

Indifference Curve, Meaning, Map, Features
Indifference curves are a fundamental concept in microeconomics that helps us understand consumer preferences and choices. They are graphical representations that depict various combinations of two goods or services that provide the same level of satisfaction to an individual.
It is a powerful microeconomic theory tool for analyzing consumer preferences and choice behavior. By understanding its features, economists can make predictions about consumer behaviour, such as how changes in prices or incomes might affect their consumption patterns. This concept provides valuable insights into the complexities of consumer decision-making and helps us build more accurate models of economic behaviour. In this blog, we will explore indifference curves' features and their significance in consumer decision-making.Indifference Curve Meaning
An indifference curve is a fundamental concept in microeconomics that serves as a graphical representation of a consumer's preferences for different combinations of two goods. It illustrates all the possible bundles of these goods that provide the consumer with the same level of utility or satisfaction. In this context, the term "indifference" means that the consumer is equally content with any combination of the two goods represented on the curve. Let's delve into the details of this definition and its implications.Graphical Representation: They are commonly represented graphically. On a Cartesian plane, the quantity of one good is plotted on the x-axis, while the quantity of the other good is plotted on the y-axis. Each point on the curve represents a specific combination of the two goods. All the points along a single indifference curve are considered equally desirable to the consumer because they offer the same level of satisfaction.
Consumer Preferences: Indifference curves provide insights into a consumer's preferences for different goods. The higher the indifference curve on the graph, the greater the level of utility associated with the corresponding combinations of goods. Conversely, lower indifference curves represent combinations that yield lower levels of satisfaction.
Downward Sloping Nature: Indifference curves typically have a negative slope, sloping downward from left to right. This characteristic reflects the inverse relationship between the two goods. As the consumer increases the consumption of one good while keeping the quantity of the other good constant, their level of satisfaction remains unchanged along the curve. This is because the consumer is willing to trade off one good for another in such a way that their overall utility remains the same.
Marginal Rate of Substitution (MRS): The slope of the indifference curve is defined as the marginal rate of substitution (MRS). The MRS measures the rate at which the consumer is willing to exchange one good for another while maintaining the same level of utility. The MRS decreases along the indifference curve, indicating that as the consumer has more of one good, they are willing to give up fewer units of the other good to maintain the same level of satisfaction.
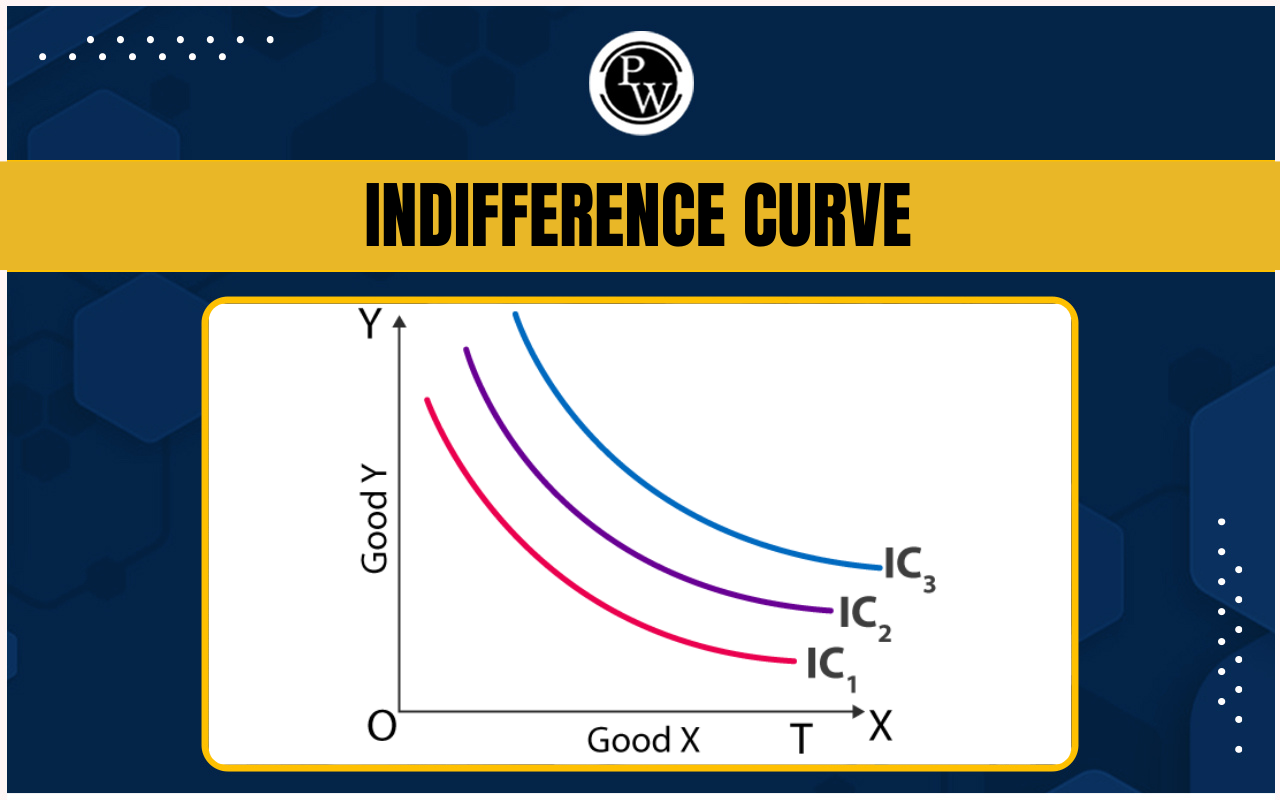
Indifference Map: A collection of indifference curves, each representing different levels of utility, forms an indifference map. This map enables a comprehensive understanding of the consumer's preferences for various combinations of goods. Higher indifference curves on the map signify higher levels of utility, reflecting the consumer's preference for those combinations.
Indifference Map
An indifference map is a graphical representation consisting of a set of indifference curves, each representing a different level of utility. These curves collectively help us understand a consumer's preferences for various combinations of goods. Higher indifference curves on the map indicate greater levels of utility and satisfaction associated with those combinations. Indifference maps offer valuable insights into how consumers make choices based on their preferences and the trade-offs they are willing to make.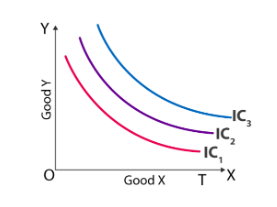
Also Check: Demand Schedule
Features of Indifference Curves
Understanding the features of indifference curves is crucial for comprehending consumer preferences and decision-making in microeconomics. These curves provide a visual representation of how consumers allocate their resources among different goods to maximize their satisfaction. By incorporating these features into economic models, economists can gain deeper insights into consumer behavior, market demand, and welfare analysis. The concepts of convexity, non-intersecting curves, downward-sloping nature, transitivity, completeness, continuity, and indifference maps collectively shape the foundation of microeconomic theory and its practical applications.Convexity: Convexity is a fundamental characteristic of indifference curves. These curves are typically bowed-out or convex to the origin. As we move along the curve from left to right, it becomes flatter.This curvature is a result of the diminishing marginal rate of substitution (MRS).
The MRS represents the rate at which a consumer is willing to exchange one good for another while keeping their utility constant.In simpler terms, it measures how much of one good a consumer is ready to sacrifice to obtain more of the other good, while maintaining the same level of satisfaction. The reason behind this convex shape lies in the concept of diminishing marginal utility. As a consumer acquires more of one good, the additional satisfaction gained from each extra unit decreases. Consequently, the consumer becomes more willing to substitute this good for another, which offers higher marginal utility. This willingness to trade off goods is reflected in the convexity of the indifference curve.Non-Intersecting Curves: Indifference curves representing different levels of utility do not intersect each other. This feature is of utmost importance as it ensures that the principle of transitivity is upheld.If two indifference curves intersected, it would imply that the same combination of goods could provide two different levels of utility, leading to logical inconsistencies in the concept of consumer preferences.
In reality, consumers' choices are rational, and the absence of intersection confirms that higher utility corresponds to higher indifference curves.Downward Sloping: Indifference curves have a negative slope, meaning they slope downward from left to right. This feature signifies the negative relationship between the two goods.As a consumer chooses to consume more of one good, they must reduce their consumption of the other good to remain on the same indifference curve and maintain a constant level of satisfaction.
The downward-sloping nature of the curve is a consequence of diminishing marginal utility. As more units of a specific good are consumed, the additional satisfaction from each unit diminishes. Therefore, to maintain a constant level of satisfaction, the consumer needs to compensate for the reduced marginal utility of the first good by consuming more of the other good.Transitivity: Transitivity is an underlying assumption in indifference curve analysis. It implies that if a consumer prefers bundle A to bundle B and bundle B to bundle C, they must also prefer bundle A to bundle C. In other words, consumers' preferences are consistent and can be ranked logically. This assumption is crucial for constructing a coherent consumer behavior and rational choice model.
Completeness: The completeness assumption states that consumers can rank different combinations of goods in terms of their preferences. In other words, consumers can make choices and compare the satisfaction they derive from different bundles of goods. This assumption enables economists to analyze and predict consumer decisions effectively.
Continuity: Indifference curves are continuous, meaning there are no gaps or jumps in the curve. This assumption ensures that consumers' preferences are smooth and predictable without any sudden changes in their rankings of different goods. The continuity feature provides a solid foundation for applying calculus and mathematical methods in analyzing consumer behavior.
Indifference Curve Analysis
The slope of the indifference curve is called the marginal rate of substitution (MRS). This represents how much of one good a consumer is willing to give up to obtain more of another good. For instance, if a consumer highly values apples, they will be less inclined to trade them for oranges, resulting in a steeper slope for the curve. Indifference curves are usually convex to the origin, and they never intersect. Consumers tend to prefer bundles of goods that lie on curves further from the origin, indicating greater satisfaction. As an individual's income increases, they often adjust their consumption levels. This allows them to afford more goods, resulting in a shift to a higher indifference curve, which means they are better off. Indifference curve analysis focuses on MRS and opportunity costs while generally assuming that other variables remain constant. Many economics textbooks use indifference curves to illustrate how consumers make optimal choices based on their income. The classic approach suggests that the best consumption bundle occurs at the point where a consumer’s indifference curve is tangent to their budget constraint.Indifference Curve FAQs
What is an indifference curve and how does it help us understand consumer preferences?
How does the downward-sloping nature of indifference curves reflect consumer behavior?
What is the significance of the convexity of indifference curves?
Why do indifference curves not intersect each other?
How does an indifference map help us understand consumer behavior?