Calculation of Mean, Median, and Mode
Learn the calculation of mean, median, and mode, the core statistical tools to analyze data effectively. Understand their formulas, examples, and applications in real-world scenarios.
Share
In statistics, mean, median and mode are fundamental tools used to analyze data and understand its distribution. Known collectively as the measures of central tendency , these three statistical methods summarize a dataset, offering insights into its central values. Each measure has unique attributes and applications, and understanding how to calculate and interpret them is essential for solving statistical problems.
In this blog, we’ll learn the definitions, formulas, and step-by-step calculations of mean , median , and mode , along with examples and their relevance in real-world scenarios.What Are Mean, Median, and Mode?
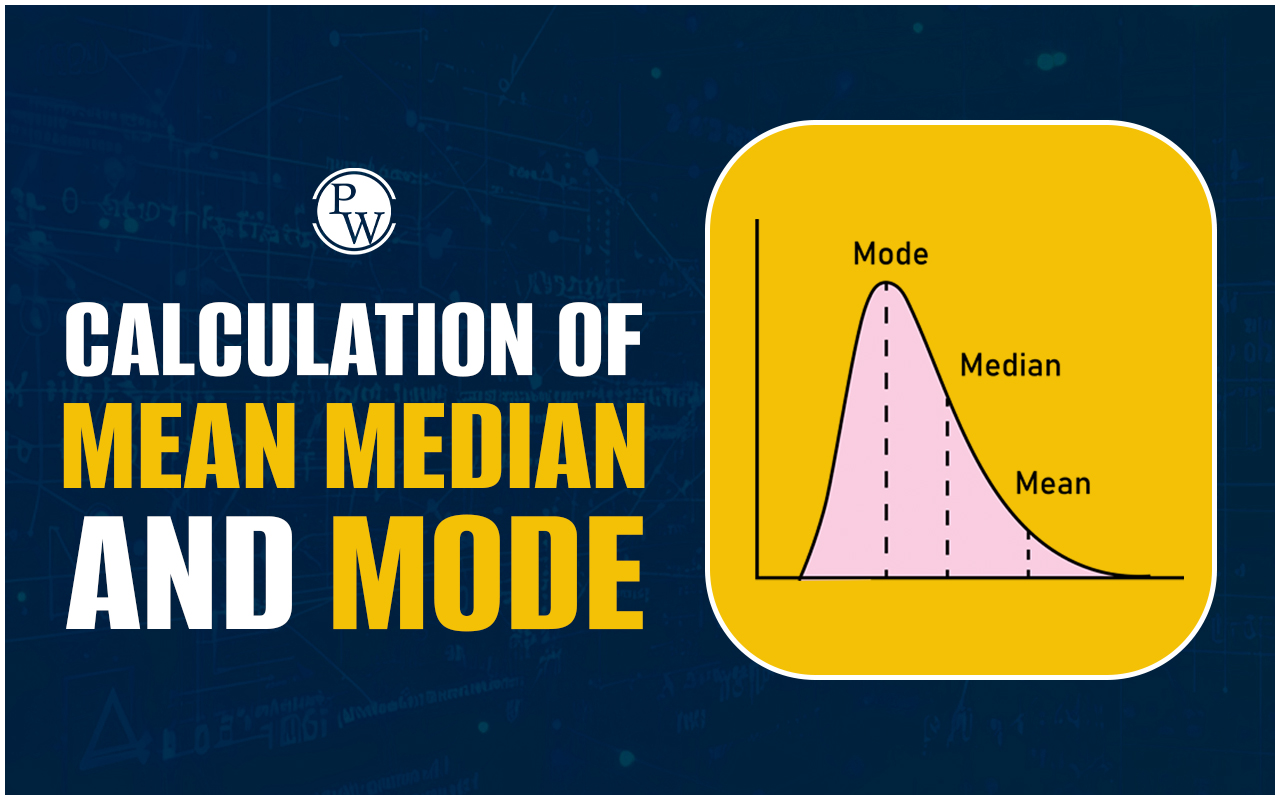
Mean : The arithmetic average of a dataset, calculated by dividing the total sum of all values by the number of values. It is widely used but can be affected by extreme values (outliers). Median : The middle value in an ordered dataset. For an odd number of observations, it is the central value; for an even number, it is the average of the two middle values. The median is particularly useful for skewed datasets. Mode : The value that appears most frequently in a dataset. Mode is ideal for categorical data or when identifying the most common value. These measures help summarize data meaningfully, making it easier to interpret and draw conclusions.Mean Calculation
The mean is the simplest and most commonly used measure of central tendency. It is calculated using the formula:- Σx: Sum of all data values
- N: Total number of observations
Example :
Dataset: 12,15,18,20,25Median Calculation
The median represents the middle value of a dataset arranged in ascending or descending order.- For odd numbers of observations, it is the middle value.
- For even numbers, it is the average of the two middle values.
Formula :
To find the median position:- l : Lower boundary of the median class
- c : Cumulative frequency before the median class
- f : Frequency of the median class
- h : Class width
Example :
Dataset: 10,12,14,16,18Mode Calculation
The mode is the value that appears most frequently in a dataset. It is particularly useful in datasets with repeated values. For grouped or continuous data, the mode is calculated using the formula:- l : Lower boundary of the modal class
- fm : Frequency of the modal class
- f1 : Frequency of the class before the modal class
- f2 : Frequency of the class after the modal class
- h : Class width
Example :
Class intervals: 0−10,10−20,20−30,30−40 , frequencies: 5,12,18,7 . Modal class: 20−30 (highest frequency: fm=18 ). f1=12 , f2=7 , l=20 , h=10Choosing Between Mean, Median, and Mode
Each measure has unique applications depending on the data's characteristics:- Mean : Best for symmetric distributions without outliers.
- Median : Suitable for skewed distributions or when outliers are present.
- Mode : Ideal for categorical data or when the most frequent value is required.
Applications in Real Life
- Education : Mean is used to calculate average test scores, while median helps identify the middle-performing student in a class.
- Healthcare : Median income or age is often used for demographic analysis.
- Business : Mode identifies the most popular product or service in a market survey.
- Finance : Mean calculates average returns, while median can highlight central tendencies in income distributions.
Calculation of Mean, Median, and Mode FAQs
What is the main difference between mean, median, and mode?
Mean is the arithmetic average of all values in a dataset.
Median is the middle value when the data is arranged in ascending or descending order.
Mode is the value that occurs most frequently in the dataset.
When should I use the median instead of the mean?
The median is preferred over the mean when the dataset has extreme values (outliers) that can skew the average. For example, in income data where a few very high incomes distort the average, the median gives a better representation of the central value.
What is the significance of mode in real-life applications?
Mode is especially useful in identifying the most common item in a dataset. For instance:
In marketing, it helps identify the most popular product.
In education, it determines the most frequently scored marks in an exam.
How are mean, median, and mode affected by skewed data?
Mean is highly sensitive to extreme values and can be skewed in either direction.
Median remains unaffected by outliers and better represents the central value in a skewed dataset.
Mode is not influenced by outliers and only reflects the most frequent value, making it less indicative of central tendency in skewed data.
Talk to a counsellorHave doubts? Our support team will be happy to assist you!

Join 15 Million students on the app today!


Free Learning Resources
PW Books
Notes (Class 10-12)
PW Study Materials
Notes (Class 6-9)
Ncert Solutions
Govt Exams
Class 6th to 12th Online Courses
Govt Job Exams Courses
UPSC Coaching
Defence Exam Coaching
Gate Exam Coaching
Other Exams
Know about Physics Wallah
Physics Wallah is an Indian edtech platform that provides accessible & comprehensive learning experiences to students from Class 6th to postgraduate level. We also provide extensive NCERT solutions, sample paper, NEET, JEE Mains, BITSAT previous year papers & more such resources to students. Physics Wallah also caters to over 3.5 million registered students and over 78 lakh+ Youtube subscribers with 4.8 rating on its app.
We Stand Out because
We provide students with intensive courses with India’s qualified & experienced faculties & mentors. PW strives to make the learning experience comprehensive and accessible for students of all sections of society. We believe in empowering every single student who couldn't dream of a good career in engineering and medical field earlier.
Our Key Focus Areas
Physics Wallah's main focus is to make the learning experience as economical as possible for all students. With our affordable courses like Lakshya, Udaan and Arjuna and many others, we have been able to provide a platform for lakhs of aspirants. From providing Chemistry, Maths, Physics formula to giving e-books of eminent authors like RD Sharma, RS Aggarwal and Lakhmir Singh, PW focuses on every single student's need for preparation.
What Makes Us Different
Physics Wallah strives to develop a comprehensive pedagogical structure for students, where they get a state-of-the-art learning experience with study material and resources. Apart from catering students preparing for JEE Mains and NEET, PW also provides study material for each state board like Uttar Pradesh, Bihar, and others
Copyright © 2025 Physicswallah Limited All rights reserved.