







Mathematics Probability Diagrams for JEE Main and Advanced by PW
 Mehjabeen Hussain5 Sept, 2026
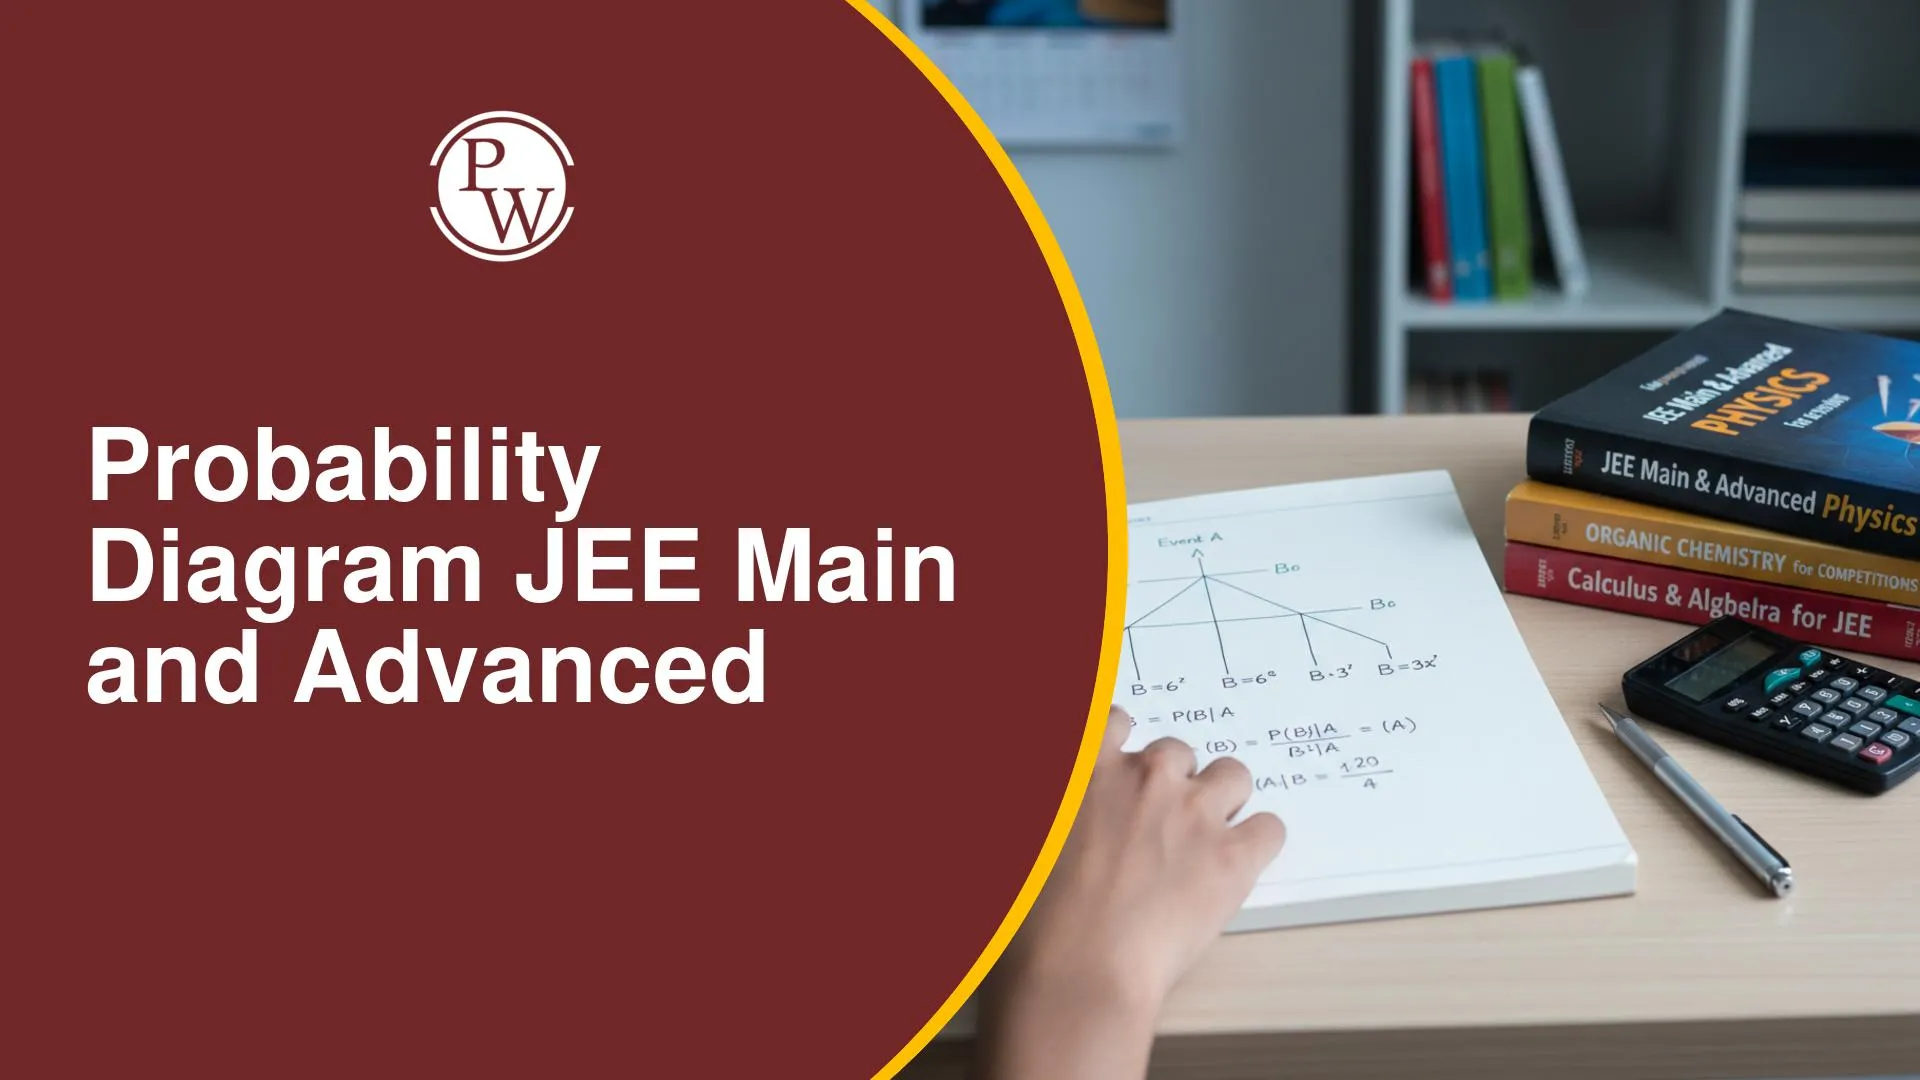
When a probability problem involves more than one event, identifying how those events are connected is often the first step. Representations such as Venn diagrams and probability trees can make overlapping events, conditional situations, and successive outcomes easier to trace before you calculate the required probability.
The Probability Diagrams for JEE Main and Advanced by PW give you a quick way to revisit these representations during exam preparation. They can help you follow event relationships, understand possible outcomes, and choose the right probability approach for JEE Main and JEE Advanced questions.
Probability Diagram PDF
The Probability Diagram PDF by PW features useful representations for understanding events and their relationships in probability. It includes visual approaches related to sample spaces, event operations, conditional probability, independent events, and sequential outcomes for JEE Main and JEE Advanced preparation.
Probability Diagram PDF
Why Use the PW Probability Diagrams?
Probability problems can involve multiple outcomes, overlapping events, or a sequence of dependent and independent events. Diagrams can help you organise the possible outcomes and understand how different events are connected before applying probability formulas.
-
Visualise the Sample Space: Use diagrams to identify all possible outcomes of an experiment and determine which outcomes belong to a particular event.
-
Understand Events as Sets: Represent events within a sample space to identify the relationship between an event and its possible outcomes.
-
Interpret Union and Intersection of Events: Use Venn diagrams to distinguish outcomes belonging to either event, both events, or their common region.
-
Understand Complementary Events: Visualise the outcomes that do not belong to a particular event and relate them to the corresponding complementary probability.
-
Represent Conditional Probability: Use event diagrams to understand how the occurrence of one event can affect the probability of another event.
-
Visualise Independent Events: Use diagrams and probability relationships to distinguish situations where the occurrence of one event does not affect another.
-
Use Tree Diagrams for Sequential Events: Follow branches representing successive outcomes to calculate probabilities when an experiment takes place in multiple stages.
-
Apply Bayes' Theorem: Use event relationships and probability trees to trace different possible causes and outcomes when conditional probabilities are involved.
-
Analyse Combined Events: Interpret diagrams involving multiple events to determine the appropriate probability relationship before solving a question.
These representations can make event relationships and possible outcomes easier to track, helping you select the appropriate probability concept when solving JEE Main and JEE Advanced questions.
You May Also Like :
FAQs
What are the important Probability concepts to revise through diagrams?
Why are diagrams useful in Probability?
What other JEE Mathematics resources does PW provide?










Get Free Counselling Today
and Clear up all your Doubts
 Live & recorded classes available at easeDashboard for progress trackingLakhs of practice questions

