Physics Wallah

Correlation and Regression, Meaning, Application, and Differences

Check the differences between correlation and regression in statistics. Learn their applications, types, and how they help in understanding relationships between variables across various fields.
authorImageMridula Sharma23 Dec, 2024
Share

Share

Correlation and Regression

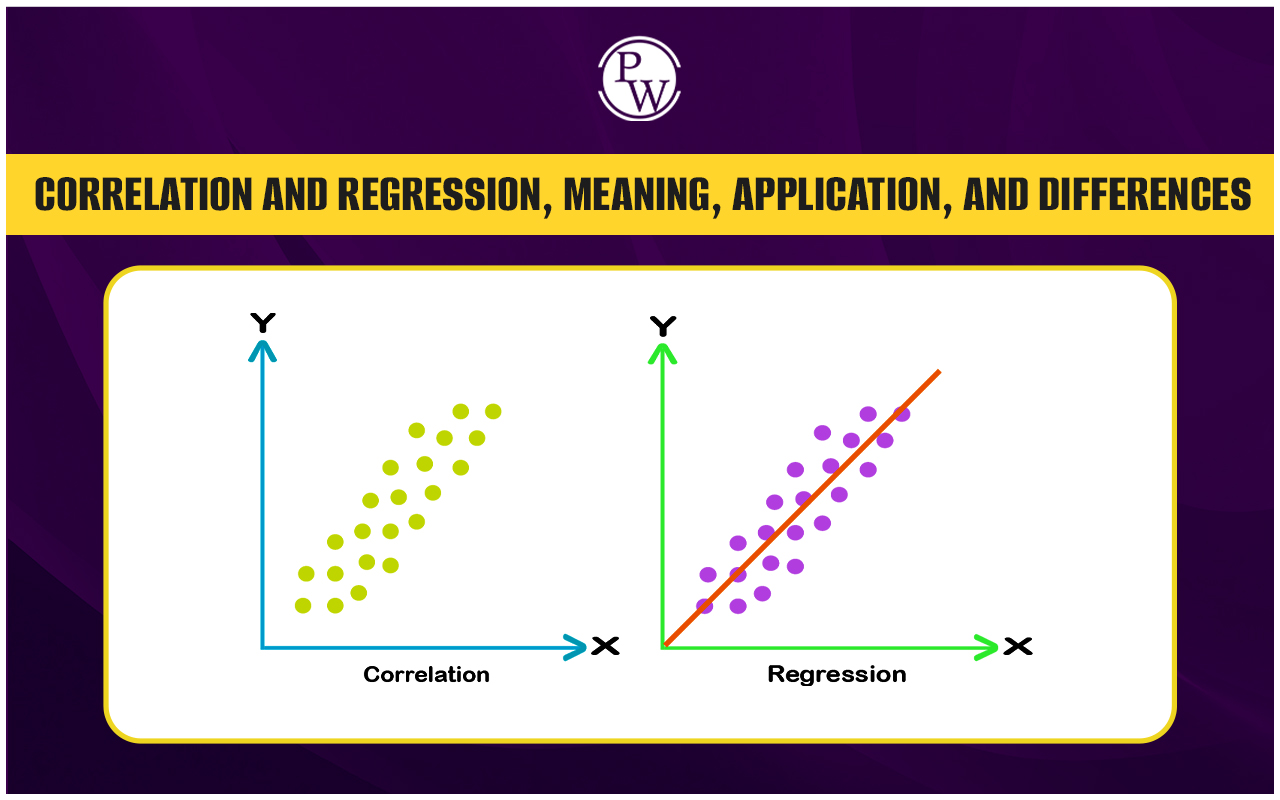
In statistics, correlation and regression are key tools for understanding the relationship between two or more numerical variables. Correlation focuses on the strength and direction of this relationship, while regression examines how changes in one variable influence another. This article will explore the differences between correlation and regression in detail for CA exams .

What Is Correlation?

The term correlation comes from the words "Co" (together) and "relation," referring to the relationship between two quantities. Correlation occurs when a change in one variable is accompanied by a corresponding change in another, either directly or indirectly. If no such connection exists, the variables are considered uncorrelated, meaning changes in one variable do not influence the other. Correlation is a statistical method used to measure the strength and direction of the relationship between pairs of variables. Correlation can be either positive or negative:
  • Positive Correlation: When two variables move in the same direction, an increase in one leads to an increase in the other, and vice versa. For example, investment and profit.
  • Negative Correlation: When two variables move in opposite directions, an increase in one results in a decrease in the other, and vice versa. For example, product price and demand.

Types of Correlation

There are three primary types of correlation commonly used:

Pearson Correlation : This method works best for nominal or continuous variables and measures only the linear relationship between them. However, it is not effective for identifying non-linear relationships.

Spearman Rank Correlation : Ideal for ordinal and continuous variables, this method captures both linear and non-linear relationships, making it versatile for various data types.

Kendall Tau Correlation : A non-parametric approach specifically designed for ranking ordinal variables. Like Spearman Rank, it can measure both linear and non-linear relationships effectively.

Application of Correlation

The following are some applications of correlation:

1. E-commerce

Correlation plays a significant role in e-commerce by analyzing patterns such as:
  • Time Spent vs. Product Purchases : Understanding how the time a customer spends on a platform relates to their purchasing behavior can help businesses refine their marketing strategies.
  • Unique Customers vs. Daily Sales : Tracking the relationship between the number of distinct customers and daily sales can guide companies in identifying their target audience and strategies to attract new customers.

2. Education

In the education sector, correlation analysis helps policymakers assess critical relationships, such as:
  • Years of Study vs. Salary Levels : Examining this link provides insights into how education influences earning potential. The findings can guide governments in revising education policies to address unemployment effectively.

3. Real Estate

Real estate relies on correlation to make data-driven decisions, including:
  • Income vs. Flat Location : Understanding how income levels influence preferences for property locations can help realtors identify target buyers.
  • Flat Location vs. Pricing : Analyzing the connection between location and property rates enables real estate developers to set competitive market prices and select optimal sites for new projects.

What Is Regression?

Regression is a statistical method used to analyze the average mathematical relationship between two or more variables. It helps estimate changes in a dependent variable (metric) based on variations in one or more independent variables. This versatile technique is widely used to predict past, present, or future outcomes using historical or current data. For instance, the future profit of a business can be forecasted using past performance records. In simple linear regression, there are two variables, x and y, where y depends on x or is influenced by x. Here:
  • y is the dependent variable (or criterion),
  • x is the independent variable (or predictor).
The regression equation is represented as: Y = a + bx Where:
  • a = constant (intercept),
  • n = regression coefficient (slope).
The constants a and b are known as the regression parameters.

Application of Regression

Regression analysis plays a crucial role in various fields by helping identify relationships and make predictions:
  • Epidemiology: Linear regression helps establish a connection between smoking and mortality rates. Here, smoking acts as the independent variable, while life expectancy is considered the dependent variable.
  • Environmental Studies: Environmental scientists use polynomial regression to predict natural phenomena like tsunamis, thunderstorms, and sandstorms well in advance.
  • Geology: Regression models are used to estimate the total natural gas reserves at different locations worldwide.
  • Other Fields: Beyond these, regression analysis is widely applied in archaeology, medicine, finance, and economics, making it a versatile tool for research and forecasting.

Difference Between Correlation and Regression

The following table highlights the key differences between Correlation and Regression, two important statistical methods. It compares their meaning, usage, variable relationships, indications, and objectives to provide a clear understanding.
Difference Between Correlation and Regression
Basis for Comparison Correlation Regression
Meaning Correlation measures the association or co-relationship between two variables. Regression defines the numerical relationship between an independent variable and a dependent variable.
Usage Represents a linear relationship between two variables. Fits the best line to estimate one variable based on another.
Dependent and Independent Variables No distinction between variables. Differentiates clearly between dependent and independent variables.
Indicates Correlation coefficient shows the extent to which two variables move together. Regression reveals the effect of changes in the independent variable (x) on the dependent variable (y).
Objective Determines a numerical value to express the relationship between variables. Estimates the value of the dependent variable based on the independent variable.
Unlock your potential with PW CA Courses! Join today to access expert-led coaching, comprehensive study materials, and personalized guidance to help you ace your CA exams and achieve success.
Also Check:
Difference between Bonus Issue And Right Issue Linear Equations Upto Three Variables
Applications of Differential and Integral Calculus Financial Mathematics
Accounting as a Measurement Discipline Elements of Financial Statements

Correlation and Regression FAQs

What is the key difference between correlation and regression?

Correlation measures the strength and direction of a relationship, while regression estimates the effect of an independent variable on a dependent variable.

Can correlation be used for prediction?

No, correlation only indicates how two variables are related but does not predict one based on the other.

What are the types of correlation?

The main types are Pearson, Spearman Rank, and Kendall Tau correlation, each suited for different data types and relationships.

What is the purpose of regression analysis?

Regression helps in predicting the value of a dependent variable based on the independent variables, useful for forecasting outcomes.
Join 15 Million students on the app today!
Point IconLive & recorded classes available at ease
Point IconDashboard for progress tracking
Point IconMillions of practice questions at your fingertips
Download ButtonDownload Button
Banner Image
Banner Image
Free Learning Resources
Know about Physics Wallah
Physics Wallah is an Indian edtech platform that provides accessible & comprehensive learning experiences to students from Class 6th to postgraduate level. We also provide extensive NCERT solutions, sample paper, NEET, JEE Mains, BITSAT previous year papers & more such resources to students. Physics Wallah also caters to over 3.5 million registered students and over 78 lakh+ Youtube subscribers with 4.8 rating on its app.
We Stand Out because
We provide students with intensive courses with India’s qualified & experienced faculties & mentors. PW strives to make the learning experience comprehensive and accessible for students of all sections of society. We believe in empowering every single student who couldn't dream of a good career in engineering and medical field earlier.
Our Key Focus Areas
Physics Wallah's main focus is to make the learning experience as economical as possible for all students. With our affordable courses like Lakshya, Udaan and Arjuna and many others, we have been able to provide a platform for lakhs of aspirants. From providing Chemistry, Maths, Physics formula to giving e-books of eminent authors like RD Sharma, RS Aggarwal and Lakhmir Singh, PW focuses on every single student's need for preparation.
What Makes Us Different
Physics Wallah strives to develop a comprehensive pedagogical structure for students, where they get a state-of-the-art learning experience with study material and resources. Apart from catering students preparing for JEE Mains and NEET, PW also provides study material for each state board like Uttar Pradesh, Bihar, and others

Copyright © 2025 Physicswallah Limited All rights reserved.