LINEAR EQUATIONS IN TWO VARIABLE
Share
LINEAR EQUATIONS IN TWO VARIABLE
Linear equations in two variable of Class 9
LINEAR EQUATIONS IN ONE VARIABLE
An equation of the form ax + b = 0 where a and b are real numbers and ‘x’ is a variable, is called a linear equation in one variable.
Here ‘a’ is called coefficient of x and ‘b’ is called as a constant term. i.e. 3x + 5 = 0, 7x – 2 = 0 etc.
LINEAR EQUATIONS IN TWO VARIABLE
An equation of the form ax + by + c = 0 or ax + by = c where a, b, c are real numbers, a ≠ 0, b ≠ 0 and x ,y are variables is called a linear equation in two variables.
Any pair of values of x and y which satisfies the equation a ≠ 0, b ≠ 0 is called a solution of it. ax + by + c = 0
|
|
In the equation ax + by + c = 0 , if a = 0 , b ≠ 0 or a ≠ 0 , b = 0 then the equation reduces to by = c or ax = c . i.e. we get equation in one variable. A linear equation in two variables has infinitely many solutions. |

question . Prove that x = 3, y = 2 is a solution of 3x - 2y = 5.
Solution: x = 3, y = 2 is a solution of 3x - 2y = 5, because L.H.S. = 3x - 2y = 3 × 3 - 2 × 2 = 9 - 4 = 5 = R.H.S.
i.e. x = 3, y = 2 satisfied the equation 3x - 2y = 5.
 it is solution of the given equation.
question . Prove that x = 1, y = 1 as well as x = 2, y = 5 is a solution of 4x - y - 3 = 0.
Solution: Given eq. is 4x - y - 3 = 0 ....(i)
First we put x= 1, y = 1 in L.H.S. of eq...(i)
Here L.H.S. = 4x - y - 3 = 4 × 1 - 1 - 3 = 4 - 4 = 0 = R.H.S.
Now we put x = 2, y = 5 in eq. (i)
L.H.S. = 4x - y - 3 = 4 × 2 - 5 - 3 = 8 - 8 = 0 = R.H.S.
Since, x = 1, y = 1 and x = 2, y = 5 both pair satisfied in given equation therefore they are the solution of given equation.
question .
Solve the equation
 and verify the answer.
Solution:
…(i)
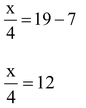
⇒ x = 48
Putting x = 48 in equation (i) we get
LHS,
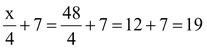 R.H.S.
Hence, L.H.S. = R.H.S