Venn Diagram - Examples, Definition, Formula, and Types

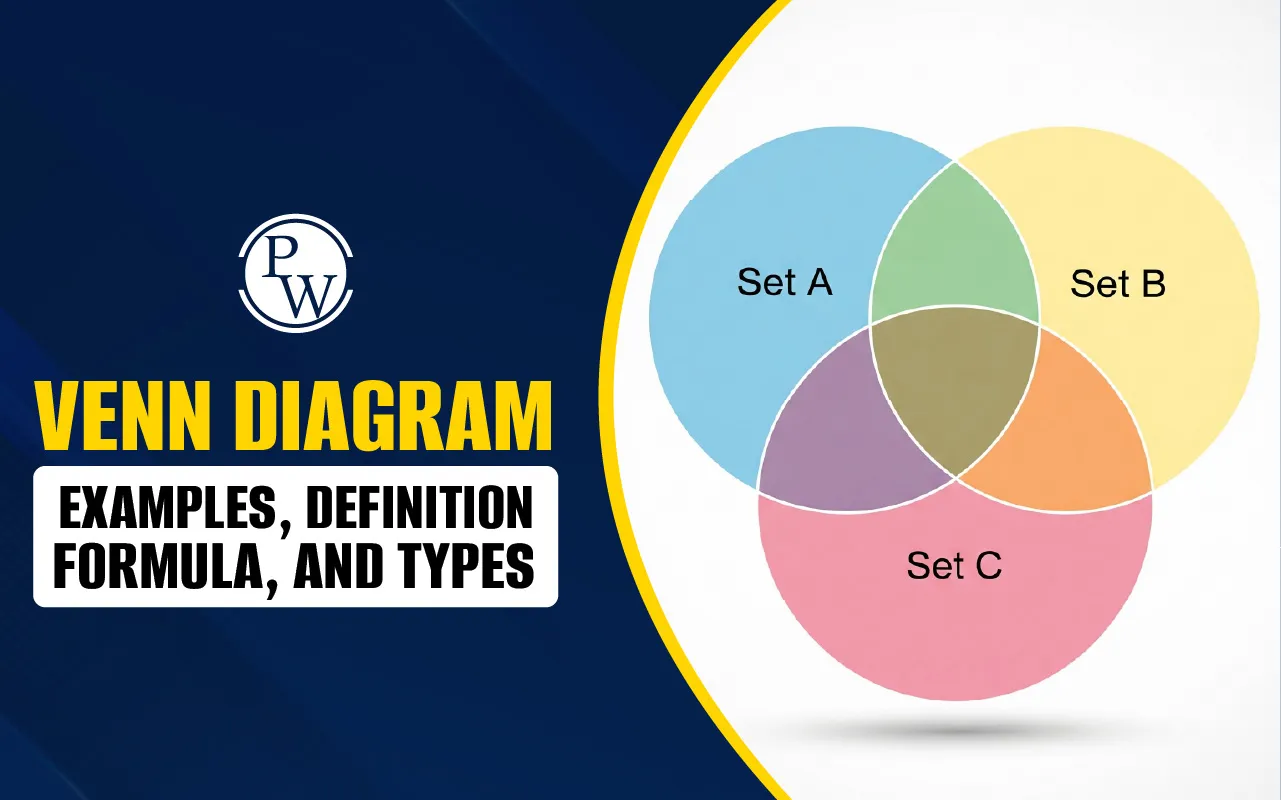
Venn diagram is a visual tool used in set theory to show the relationships between different sets. Each set in a Venn diagram is represented by a circle. The areas where the circles overlap show the elements that the sets share.
This helps identify what is common, what is unique, and how the sets are connected. Venn diagrams are commonly used to organise information, compare different groups, and analyse logical relationships between data sets.
Here, we have discussed the definition of Venn diagrams, the steps to draw them, the various types of Venn diagrams, and examples to help students understand the concept and solve related questions accurately.
Read More: Basic Geometrical Ideas
What is a Venn Diagram?
A Venn diagram is a diagram made up of circles. These circles help us compare different groups of things. Each circle stands for one group, which we call a set. A set can be anything, like types of food, animals, colors, or people who like different activities.
When two or more circles in a Venn diagram overlap, it means those sets share something in common. The overlapping part shows what is the same in both groups. The parts of the circles that do not overlap show what is different in each group.
For example, think about a group of students. One circle represents students who like apples, while another shows those who like bananas. The overlapping area shows students who like both. If a student likes both apples and bananas, they will be in the part where the circles overlap. If a student likes only apples, their name will be in the part of the apple circle that does not touch the banana circle.
How to Draw a Venn Diagram?
Venn diagrams help visually represent the relationship between sets using circles and a rectangle for the universal set. Follow these simple steps:
Step 1: Draw the Universal Set
Start by drawing a large rectangle. This represents the universal set, which contains every element relevant to the problem or situation.
Step 2: Draw Circles for Each Set
Inside the rectangle, draw a circle for each set you are working with. If there are two or more sets, position the circles so they overlap where needed. Each circle represents a specific group, and the overlapping sections show elements shared by those groups.
Step 3: Fill in the Diagram According to the Problem
Use the information given to shade, mark, or label the appropriate sections of the circles. For example, if the question asks for an intersection, highlight only the overlapping parts. If it asks for a union, include all areas covered by the sets involved. Label each set clearly to make the diagram easy to understand.
Read More: What is Slope Formula
Venn Diagram Example
Let us look at a Venn diagram example to understand the concept better.
We have two sets:
-
Set A contains all even numbers between 1 and 25
-
Set B contains all the numbers in the 5 times table between 1 and 25
Let us write each set:
Set A includes all the even numbers between 1 and 25. T
These are numbers that can be divided by 2:
2, 4, 6, 8, 10, 12, 14, 16, 18, 20, 22, 24
Set B includes all the multiples of 5 between 1 and 25
These are numbers you get when you multiply 5 by 1, 2, 3, 4, and 5:
5, 10, 15, 20, 25
Now, we use a Venn diagram to show these two sets.
-
One circle is for Set A (even numbers), and the other circle is for Set B (multiples of 5)
-
The part where the circles overlap shows numbers that belong to both sets
Let us find which numbers are in both sets.
From the lists above, the numbers that appear in both sets are 10 and 20. These numbers are even and are also multiples of 5.
So in the Venn diagram:
Left circle (Set A) will have
2, 4, 6, 8, 12, 14, 16, 18, 22, 24
Right circle (Set B) will have
5, 15, 25
Middle overlapping part will have
10, 20
This shows the relationship between the two sets.
Read More: Area and Perimeter
Venn Diagram Symbols
When we talk about sets and Venn diagrams in math, we use special symbols. Here are a few important Venn Diagram symbols:
-
∪ means union. It shows everything in both sets.
-
∩ means intersection. It shows only what is common between the sets.
-
A' (or Ac) means complement. It shows everything that is not in set A.
Let’s look at what they mean:
A ∪ B (A union B)
It means all elements that are in set A, set B, or both.
A ∩ B (A intersection B)
It means only the elements that are common to both sets A and B.
A′ (A complement)
It means all elements that are not in set A, but still within the universal set.

Read More: Simple Equations
Venn Diagram for Sets Operations
A Venn diagram shows how different sets are related. When we work with sets in math, we often use operations to understand how the sets are connected. These operations tell us what is shared, what is different, and what is outside a set.
There are four main operations we use in set theory. Let us look at each one with easy examples and how they are shown in a Venn diagram.
1. Union (A ∪ B)
Union means we are combining everything from both sets. We include all items, but we do not repeat any.
Example
Let Set A = {1, 2, 3}
Let Set B = {3, 4, 5}
To find A ∪ B, we put together all the numbers from both sets:
A ∪ B = {1, 2, 3, 4, 5}
In the Venn diagram, union means the whole area covered by both circles, including the overlapping part.

2. Intersection (A ∩ B)
Intersection means we only look at the items that are in both sets at the same time.
Example
Let Set A = {1, 2, 3}
Let Set B = {3, 4, 5}
To find A ∩ B, we look for items that appear in both sets.
A ∩ B = {3}
In the Venn diagram, intersection is shown as the overlapping part between the two circles.

3. Difference (A − B)
Difference means we find items that are in Set A but not in Set B.
Example
Let Set A = {2, 3, 4, 5, 6, 7}
Let Set B = {3, 5, 7, 9, 11, 13}
We now find:
A − B = items in A that are not in B
A − B = {2, 4, 6}
B − A = items in B that are not in A
B − A = {9, 11, 13}
So, the difference helps us see what is unique to each set.

4. Complement (A′)
Complement means we are looking for everything that is not in Set A.
To show this, we use a big rectangle around the Venn diagram. This rectangle is called the universal set, and it contains all possible items.
Example
Let the universal set be the set of natural numbers:
N = {1, 2, 3, 4, 5, 6, 7, 8, 9, 10, ...}
Let Set A be the set of even natural numbers:
A = {2, 4, 6, 8, 10, 12, ...}
Now, the complement of A, written as A′, means all the natural numbers that are not in A.
So, A′ = {1, 3, 5, 7, 9, 11, ...}
These are the odd natural numbers, since they are not in the even number set A.
In a Venn diagram
-
The rectangle represents the universal set N
-
The circle represents set A
-
Everything outside the circle but still inside the rectangle is A′
This shows us that the complement is simply what is not in the set we are looking at.

Read More: What is Factorization Formula?
Venn Diagram Formula
We also use Venn Diagram formulas to find how many items are in sets. Here are the basic formulas:
For Two Sets:
n(A ∪ B) = n(A) + n(B) - n(A ∩ B)
This formula tells us how many items are in either set A or set B or both.
-
n(A) means number of items in set A
-
n(B) means number of items in set B
-
n(A ∩ B) means number of items in both A and B
Example: A class has 18 students who like Math and 16 students who like Science. Ten students like both subjects. How many students like either Math or Science?
Using the formula:
n(A ∪ B) = 18 + 16 - 10 = 24
So, 24 students like at least one of the two subjects.
For Three Sets:
n(A ∪ B ∪ C) = n(A) + n(B) + n(C) - n(A ∩ B) - n(B ∩ C) - n(C ∩ A) + n(A ∩ B ∩ C)
This helps when we are comparing three sets and their overlaps.
Also read: Perimeter of Rectangle
Why Are Venn Diagrams Useful?
Venn diagrams are helpful because they show how groups are the same and how they are different. They make it easier to:
-
Understand relationships between sets
-
Solve math problems
-
Compare things clearly
-
Think logically and solve problems
-
Organize information in a visual way
Teachers use them in class to compare characters, animals, foods, and more. They are simple, useful, and easy to understand.
Strengthen Your Child’s Maths Skills with CuriousJr Online Classes
Is your child finding it difficult to keep up with school maths? CuriousJr Online Maths Classes provide the right learning environment to help them catch up, keep up, and move ahead with confidence.
Every session is guided by dedicated mentors who explain concepts clearly and support your child throughout their learning journey. We combine concept learning with practice and personal attention, so your child doesn't just memorise—they truly understand.
Here’s how we make it happen:
-
Two dedicated teachers in every session – one leads the lesson, the other focuses on clearing doubts
-
Homework help is included, so your child can manage school tasks with less stress
-
Extra worksheets give them the chance to practice regularly and improve steadily
-
Doubt-solving during and after class ensures they’re never left behind
-
Progress reports keep you updated on how your child is doing week by week
With consistent support, your child can rebuild confidence and enjoy learning maths again. Book a demo class today.
Venn Diagram FAQs
What is a Venn diagram used for?
Who invented the Venn diagram?
What are the main parts of a Venn diagram?
How many sets can a Venn diagram show?
What is the universal set in a Venn diagram?