X and Y Axis: Equation and Examples

X and Y Axis - The X and Y axes are the core concepts for drawing graphs representing two variables and their relationships through an effective pictorial form. Suppose you want to know how your height increases with age; use the x-axis and y-axis to plot these two values and get an amazing growth curve!
For presenting and interpreting medical, scientific, or economic data, the x and y axis becomes a handy tool. This blog explains what the x and y axes are and their functions, and provides simple x and y-axis graph examples. You can understand how these horizontal and vertical lines provide a framework for graphical interpretation and decision-making.
Also read: Profit and loss formula
What Are the X and Y Axis?
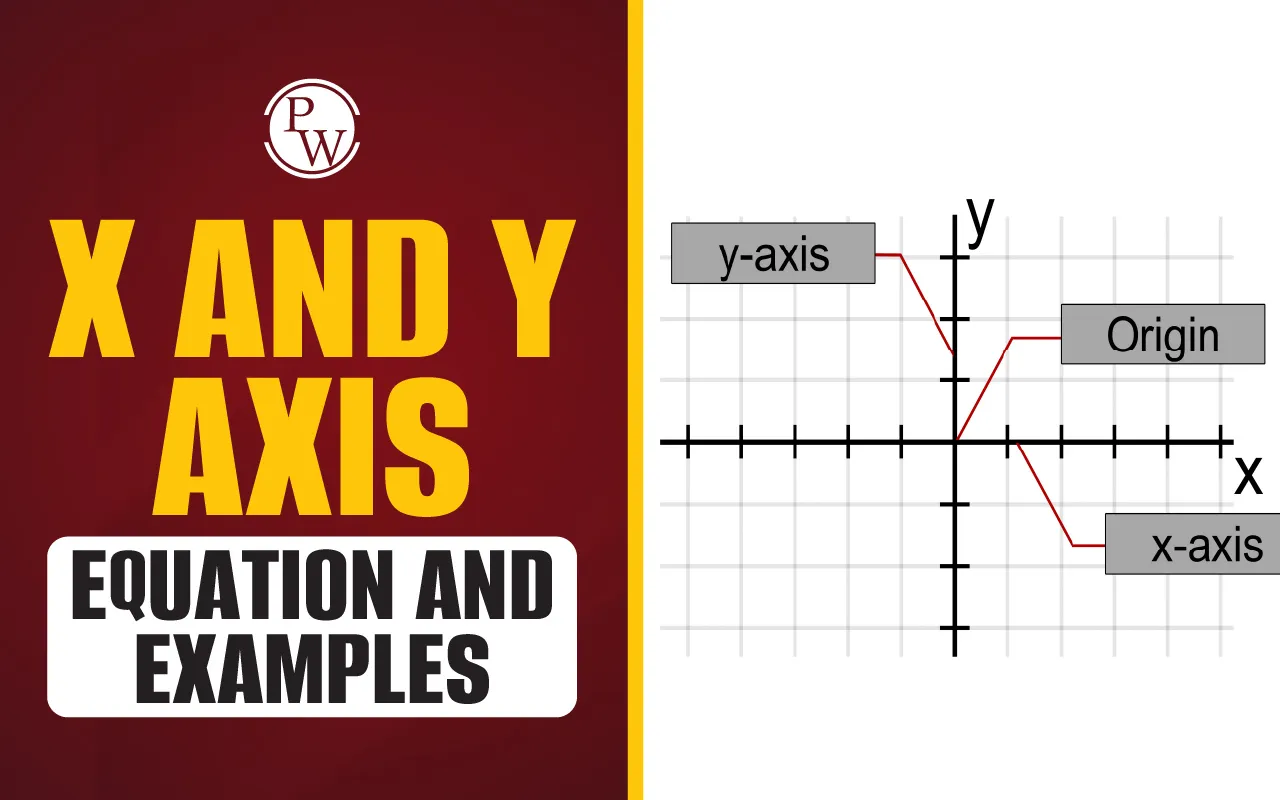
The x and y axis are two perpendicular lines that form the basis of drawing a graph. They are the main two lines in the cartesian coordinate plane, which are used as references to locate points, plot graphs, and represent relationships between variables in two dimensions.
-
X-axis: It is the horizontal line that runs left to right.
-
Y-axis: It is the vertical line that runs up and down.
The x-axis is also called the abscissa, and the y-axis is called the ordinate.
These two lines intersect at a point called the origin.
Also read: Difference between 2D and 3D shapes
Where Are the X Axis and Y Axis on a Graph?
In the cartesian plane, the X-axis is the horizontal line that divides the area into two equal parts: top and bottom. Similarly, the Y-axis is the vertical line that divides the area into two equal parts: left and right. These number lines help find the values while plotting a graph. These two lines meet at the origin for which both the x and y values are zero.
The x-axis and y-axis contain values that are positive as well as negative. Let's explain in detail:
-
Positive x-axis: The right-hand side of the origin
-
Negative x-axis: The left-hand side of the origin
-
Positive y-axis: The upward direction from the origin
-
Negative y-axis: The downward direction from the origin

Plotting Points Using X-axis and Y-axis
The x-axis, and y-axis denote the position of a point on a coordinate plane. Any point is expressed as (x, y) where x is the x-coordinate value and y is the y-coordinate value. The x-coordinate denotes a value on the x-axis, and the y-coordinate denotes a value on the y-axis. Please note the following while looking at the values of x and y:
-
Positive x-values increase toward the right.
-
Negative x-values extend to the left of the origin.
-
Positive y-values go upwards.
-
Negative y-values go below the origin.
Also read: Quadrilateral
Quadrants Formed by X-axis and Y-axis
The x and y axes combinedly divide the graph into four quadrants, which are numbered counterclockwise:
-
Quadrant I: Contains points with positive x-values and y-values
-
Quadrant II: Contains points with negative x-values and positive y-values
-
Quadrant III: Contains points with negative x-values and y-values
-
Quadrant IV: Contains points with positive x-values and negative y-values

X and Y Axis Graph Example
Let's look at a simple x and y-axis graph example for plotting points.
Suppose you want to plot these points:
-
A (1, 3)
-
B (−3, 1)
-
C (−2, −2)
-
D (3, −2)
Follow the below-mentioned steps to place the points:
-
Point A (Quadrant I): Go 1 unit to the right on the x-axis from the origin and move 3 units up parallel to the y-axis.
-
Point B (Quadrant II): Go 3 units to the left starting from origin and move 1 unit up.
-
Point C (Quadrant III): Go 2 units to the left from the origin and move 2 units down parallel to the y-axis.
-
Point D (Quadrant IV): Go 3 units to the right from the origin and then 2 units down.
This simple activity helps you understand how points are plotted using the x-axis and y-axis.

How to Write Equations of X Axis and Y Axis
The x-axis and y-axis are straight lines, so they must have equations to represent them. The equation of a straight line going through the origin is y = mx. However, equations of x and y axes are very straightforward. Let's find out:
Equation of the X-Axis:
On the x-axis, the y-coordinate is always zero because you are moving along the x-axis but not moving up or down.
So, the equation of the x-axis is: y = 0
It means that for any point on the x-axis, the value of the y-coordinate is zero.
Examples of points on the x-axis are (2, 0), (−5, 0), (12, 0), etc.
Equation of the Y-Axis:
On the y-axis, the x-coordinate is always zero because you are only moving up and down but not moving left or right.
So, the equation of the y-axis is: x = 0
It means that for any point on the y-axis, the value of the x-coordinate is zero.
Examples of points on the y-axis are (0, -6), (0, −7), (0, 15), etc.
Also read: Equation: Definition, Types, Examples, Differences
What Is the Purpose of the X and Y Axis?
The x and y axes become useful in pictorial representation and graphic solutions of different mathematical problems. The x-axis and y-axis are used in the following activities:
-
Representing relationships between two variables.
-
Locating the position of points on a plane
-
Draw lines and curves representing equations.
-
Interpret data from charts, bar graphs, etc.
-
Analyze trends in the fields of physics, economics, or statistics.
X and Y Axis Examples
The concepts of the x and y axes are not just limited to textbooks; they are used in many practical applications where various data types and their inter-relations are represented graphically. It helps in better understanding and decision-making. Here are some examples:
Business Graphs: Companies use graphs to compare profit (y-axis) over time (x-axis).
Science: In physics, graphs represent the relation between two parameters—for example, velocity (y-axis) vs. time (x-axis).
Economics: Trend analysis is done by plotting magnitude against period. For example, GDP can be shown through bar graphs (y-axis) for different years (x-axis).
Computer Graphics: Every visual element on a screen has an x and y position to determine its location.
Medical Charts: Doctors use x and y-axis charts to monitor heart rates, blood pressure, or glucose levels over time.
Also read: What is a Pie Chart?
Drawing a Line on Graph Using X-Axis and Y-Axis
The equation of a straight line is represented as y = mx + c (m and c are constant). If we take different values of x, for each value of x, we get a unique value of y, stratifying the equation.
We take these x and y values as the x-coordinate of the y-coordinate of points and plot them on the graph using the x and y-axis. When we draw a line through all these points, it gives the graphical representation of the given straight-line y =mx + c
Let's explain with an example. The equation of a line is y= 2x + 1
Now, for different values of x, we get different values of y as follows:
|
x |
0 |
1 |
2 |
-1 |
-2 |
-3 |
|
y |
1 |
3 |
5 |
-1 |
-3 |
-5 |
Now, by plotting these points on the graph and joining them, we get a straight line that represents y = 2x +1
Also read: Basic Maths Formula
Important Points About X and Y Axis
-
X-axis is horizontal, and the Y-axis is vertical and intersects at the origin.
-
The x-coordinate and y-coordinate of origin are (0, 0).
-
Origin is the middle point of the X and Y axis.
-
There are infinite points on the X and Y axis -both positive and negative.
-
The point where a graph meets x -the x-axis is called the x-intercept.
-
The point where a graph meets the y-axis is called the y-intercept.
-
The X-axis measures the independent variable, and the Y-axis measures the dependent variable.
The x and y axes are important for measuring, representing, and visualizing relationships between variables. Understanding the x-axis and y-axis, practicing with x and y-axis graph examples, and learning how to write the equation of the x-axis and y-axis will help apply them in many practical applications.
Also read: Angles Meaning and Definition
Make Math Learning Fun and Effortless with CuriousJr's Mental Math Online Classes
Is your child struggling with slow calculations, weak number sense, or confusion around basic math concepts? CuriousJr's Kids Online Classes helps them address these issues with engaging, effective strategies that boost analytical approach and focus.
Why Choose CuriousJr Mental Math Online Classes?
-
Students learn faster and solve problems with improved accuracy using over 50 clever mental math techniques.
-
The course evaluates each child's strengths and areas for improvement, tailoring the content to suit their unique learning style.
-
Interactive and visual Learning with logic-based approaches make Learning enjoyable and impactful.
-
Dedicated mentors help students learn concepts, clear doubts, and stay motivated throughout their learning process.
This course enhances problem-solving skills and develops a solid foundation in mathematics for students in classes 1 to 8. Book a free demo class today with Curious Junior and help your child develop a better understanding of math while having fun.
Do you need help with your homework or preparing for exams?
Study without using the internet
X and Y Axis FAQs
What is the equation of a straight line parallel to the x-axis?
What are the independent and dependent variables for the x and y axis?
Do (8, 0), (4, 0), and (0, 4) lie on the same line?
How does y vary with x for the equation y = x?