What is Pie Chart: Formula, Steps to Create, Uses, Examples
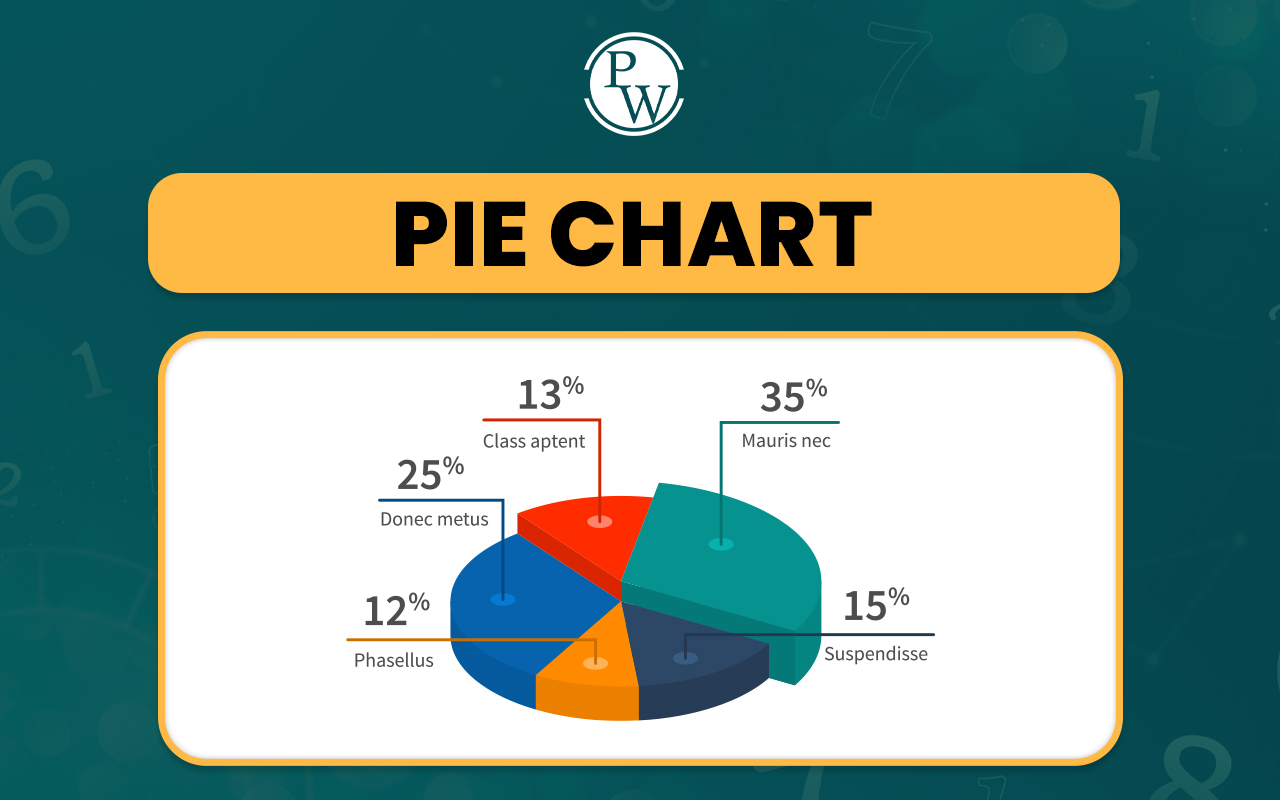
Pie Chart: A pie chart is a circular graph used to represent data in a visual way, where the entire circle represents the whole dataset, and the individual slices or sections represent different categories within that dataset. Each slice’s size is proportional to the quantity it represents, making it easy to compare the parts to the whole.
Pie charts are used to display data in percentages, making it clear how each category contributes to the total. This type of chart is particularly effective for showing simple proportions or parts of a whole, such as market shares, population distribution, or survey results.Also Check: Geometry
About CuriousJr Mental Maths Classes
At CuriousJr , part of Physics Wallah, we provide specialized Mental Maths Classes that help students master problem-solving skills. With over 50 mental math strategies our program is designed to enhance both speed and accuracy in calculations. Our classes focus on developing logical reasoning and critical thinking skills enabling students to tackle complex problems effortlessly. By participating in our CuriousJr classes, you will not only improve your ability to solve challenging tasks but also strengthen your overall cognitive abilities. This empowers you to achieve more in less time making learning math an enjoyable and rewarding experience.What is a Pie Chart?
A pie chart is a circular graph that represents data in the form of slices or sectors. Each slice or sector of the pie corresponds to a specific category and illustrates the proportion of that category relative to the whole dataset. The size of each slice is determined by the percentage or proportion of the category's value compared to the total value, with the entire pie representing 100% of the data. Pie charts are useful for showing the composition or distribution of a whole, making it easy to visualize how different parts contribute to the total. They are commonly used in cases where you need to represent categorical data, such as market shares, population distributions, or survey results. Each sector is labeled to indicate the category it represents, and the chart is typically divided into segments that add up to 360° (representing the full dataset).Also Read: AM and PM
Formula for Pie Chart
A pie chart represents data in a circular form, where the total value is always 100%. Since the total angle in a circle is 360°, the pie chart is divided into sectors where each sector represents a category of data. There are two primary formulas used for pie charts:- To calculate the percentage of the given data, we use the formula: (Frequency ÷ Total Frequency) × 100
- To convert the data into degrees we use the formula: (Given Data ÷ Total value of Data) × 360°
How to Create a Pie Chart?
Creating a pie chart is a simple process that allows you to represent categorical data visually. Here’s a step-by-step guide:Step 1: What is a Pie Chart?
A pie chart is a way to show information in a circle. It looks like a pizza or pie, and each slice shows part of the data.Step 2: Example Data
Collect and Organize the Data
The second step is to gather your data and organize it into a table. For example, let’s say you conducted a survey of students' favorite sports, and the data is as follows:| Sport | Number of Students |
|---|---|
| Football | 10 |
| Hockey | 5 |
| Cricket | 5 |
| Basketball | 10 |
| Badminton | 10 |
Step 3: Add All the Numbers
Find the total number of students. 10 + 5 + 5 + 10 + 10 = 40 studentsStep 4: Find the Percentages
Use this formula: Percentage = (Number for each sport / Total) x 100 Football: (10 / 40) x 100 = 25% Hockey: (5 / 40) x 100 = 12.5% Cricket: (5 / 40) x 100 = 12.5% Basketball: (10 / 40) x 100 = 25% Badminton: (10 / 40) x 100 = 25%Step 5: Find the Angles
A circle is 360 degrees. Use this formula: Angle = (Number for each sport / Total) x 360 Football: (10 / 40) x 360 = 90 degrees Hockey: (5 / 40) x 360 = 45 degrees Cricket: (5 / 40) x 360 = 45 degrees Basketball: (10 / 40) x 360 = 90 degrees Badminton: (10 / 40) x 360 = 90 degreesStep 6: Draw the Pie Chart
Draw a Circle : Use a compass or any round object to draw a circle on a piece of paper.
Mark the Central Angle : Using a protractor, measure each central angle and draw the sectors. Start from a reference line (like a vertical radius) and move clockwise.
- For Football , draw a 90° sector.
- For Hockey , draw a 45° sector.
- Repeat for the other categories.
Label the Sectors : Inside or outside each sector, label the category and the percentage it represents.
Step 7: Color the Sectors
To make the pie chart visually appealing, color each sector using different colors. This will help in distinguishing between the different categories.Uses of Pie Chart
Pie charts are a popular way to represent data visually, especially when comparing parts of a whole. They are ideal for showing how a set of categories contributes to the total. Here are some common uses of pie charts:Business Applications :
- Profit and Loss : Businesses often use pie charts to display profits and losses. By comparing different sectors of income or expenditure, they can assess which areas are contributing the most or least to their financial performance.
- Market Share : Pie charts are used to compare the market share of different companies or products within the same industry. This helps businesses understand the distribution of market dominance.
Educational Purposes :
- Grades and Performance : In schools, pie charts are commonly used to show student performance as percentages. For instance, a pie chart can illustrate the proportion of students achieving different grade ranges (A, B, C, etc.).
- Time Allocation : Teachers may use pie charts to represent how time is divided among different subjects or activities in a curriculum.
Social and Demographic Data :
- Population Distribution : Pie charts can be used to compare the population distribution of different regions or communities, showing how a specific population is divided among various groups.
- Vehicle Ownership : A pie chart can represent data on the ownership of different types of vehicles, comparing the proportion of people owning cars, motorcycles, bicycles, etc.
Marketing and Sales :
- Brand Comparison : In marketing, pie charts are used to compare the popularity or sales of different brands. They provide an easy way to visualize the market share of various brands or products.
- Customer Preferences : Companies often use pie charts to showcase customer preferences for different products, allowing for quick analysis of which products are favored by the majority.
Resource Distribution :
- Budget Allocation : Governments, businesses, and organizations use pie charts to show how funds or resources are distributed across various departments or sectors.
Examples of Pie Chart
Question: The pie-chart shows the marks obtained by a student in an examination. If the student secures 440 marks in all, calculate the marks in each of the given subjects. Solution: The given pie chart shows the marks obtained in the form of degrees. Given, total marks obtained = 440 i.e. 360 degrees = 440 marks Now, we can calculate the marks obtained in each subject as follows. Marks secured in mathematics = (central angle of maths/ 360°) × Total score secured = (108°/ 360°) × 440 = 132 marks Marks secured in science = (central angle of science / 360°) × Total score secured = (81°/ 360°) × 440 = 99 marks Marks secured in English = (central angle of English/ 360°) × Total score secured = (72°/ 360°) × 440 = 88 marks Marks secured in Hindi = (central angle of Hindi / 360°) × Total score secured = (54°/ 360°) × 440 = 66 marks Marks secured in social science = (central angle of social science / 360°) × Total score secured = (45°/ 360°) × 440 = 55 marks This can be tabulated as:| Subject | Mathematics | Science | English | Hindi | Social science | Total |
| Marks | 132 | 99 | 88 | 66 | 55 | 440 |
Question:
Construct a pie chart to visually display the favorite fruits of the students in a class based on the given data: Mango - 45; Orange - 30; Plum - 15; Pineapple - 30; Melon - 30Solution:
Step 1: Create a table with the values and get the total.
| Fruit | Number of Students |
|---|---|
| Mango | 45 |
| Orange | 30 |
| Plum | 15 |
| Pineapple | 30 |
| Melon | 30 |
| Total | 150 |
Step 2: Find the percentage of each value:
Mango = (45/150) × 100 = 30% Orange = (30/150) × 100 = 20% Plum = (15/150) × 100 = 10% Pineapple = (30/150) × 100 = 20% Melon = (30/150) × 100 = 20%Step 3: Finding the degree of each pie sector using the formula: (Given data/Total Value of data) × 360°
| Category | Formula | Degree |
|---|---|---|
| Mango | (45/150) × 360° = 108° | 108° |
| Orange | (30/150) × 360° = 72° | 72° |
| Plum | (15/150) × 360° = 36° | 36° |
| Pineapple | (30/150) × 360° = 72° | 72° |
| Melon | (30/150) × 360° = 72° | 72° |
Pie Chart FAQs
What is a Pie Chart?
What is the Difference Between Pie Charts and Bar Graphs?
Can You Use a Pie Chart for Continuous Data?
Can a Pie Chart Have More than One Slice?