

Historical Change In Sectors
Sectors Of Indian Economy of Class 10
Historical Change In Sectors
At initial stages of development, primary sector was the most important sector of economic activity. As the methods of farming changed and agriculture sector began to prosper. It produced much more food than before. Many people could now take up other activities. Over a long time (more than hundred years), and especially because new methods of manufacturing were introduced, factories came up and started expanding. Those people who had earlier worked on farms now began to work in factories in large numbers. People began to use many more goods that were produced in factories at cheap rates. Secondary sector gradually became the most important in total production and employment. Hence, over time, a shift had taken place. This means that the importance of the sectors had changed.
In the past 100 years, there had been a further shift from secondary to tertiary sector in developed countries. The service sector has become the most important in terms of total production. Most of the working people are also employed in the service sector. This is the general pattern observed in developed countries.
INTERDEPENDENCY OF SECTORS:
To understand this interdependency, let us take an example of a cold drink. A cold drink contains water, sugar and artificial flavor. Suppose if there is no sugarcane production then procuring sugar will become difficult and costly for the cold drink manufacturer. Now to transport sugarcane to sugar mills and sugar to the cold drink plant needs the services of a transporter. A person or system of persons is required to maintain and monitor all these movements of goods from farm to factory to shop in different locations. That is where role of administrative staffs comes. Let us go back to the farmer. He also needs feritlisers and seeds which is processed in some factory and which will be delivered to his doorstep by some means of transportation. To top it all at every step of these activities we require the proper monetary and banking system. So, in a nutshell this describes how interrelated all sectors of an economy are.
Growth and Status of Different Sectors in India.
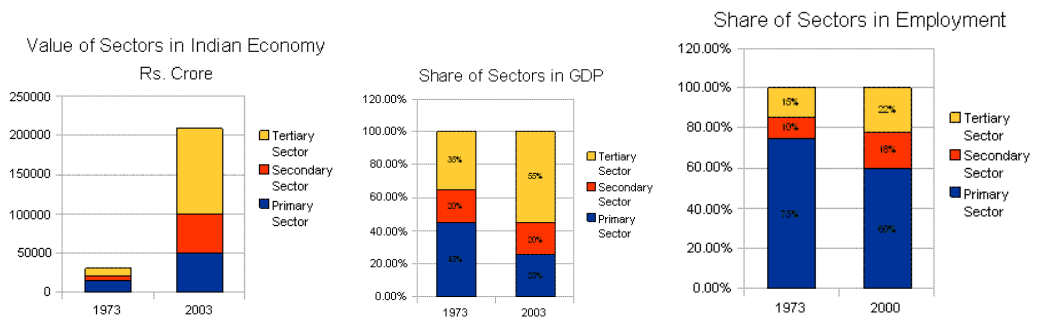
Closely observe the given graphs. The first graph shows the rupeewise turnover of various sectors in 1973 and 2003. The second graph shows the share of three sectors in the GDP during these 20 years and last graph shows share in providing employment.
The first graph shows a massive increase in turnover for all these sectors during 20 years, which shows the way our economy grew. The second graph shows that share of agriculture decreased substantially and that of industry remained static and share of services grew. Particularly the growth of share of services sector was phenomenal from 35% to 55%.
Now the third graph paints a distressing picture. The share in providing employment was not in tune with the share in GDP. The agriculture provided employment to 75% workers and this decreased to 60% in 2000, which is not as big a drop as agriculture’s drop in GDP contribution. On the other hand the growth in employment provided by other two sectors was substantially low.
The meaning of this finding is as follows:
- Majority of people are still employed in agricultural activities. As agriculture provides seasonal employment during cropping season so chances of hidden employment are big. Moreover, as history suggests a developed nation’s dependency shifts from primary sector towards tertiary sector in all aspects of economic development, so it can be said that India is still way behind because majority still depend on agriculture.
- Secondary and Tertiary Sector have failed to generate enough employment opportunities making a pressure on primary sector. Although educated and skilled workforce do get employed in secondary and tertiary sector but for unskilled and semi-skilled workers there is still shortage of employment avenues.