
NCERT Solutions for Class 11 Maths Chapter 5 Exercise 5.2
NCERT Solutions for Class 11 Maths Chapter 5 Exercise 5.2: Class 11 Mathematics Chapter 5, titled Linear Inequalities, is a fundamental topic that helps students understand how to deal with relationships between quantities that are not necessarily equal. Unlike linear equations, which represent exact relationships, linear inequalities express conditions where one quantity is less than, greater than, or equal to another, providing a more flexible approach to problem-solving.
Exercise 5.2 of this chapter details about solving and graphing linear inequalities, both in one and two variables. It provides students with essential skills for handling inequalities in real-world contexts, such as budgeting, planning, and optimization problems. NCERT Solutions for Class 11 Maths Chapter 5 Exercise 5.2 offer a detailed breakdown of each problem, allowing students to follow the correct methods and improve their problem-solving techniques. Through clear step-by-step explanations, these solutions enhance students' understanding, providing the support they need to excel in both their exams and practical applications of linear inequalities. Students can check the NCERT Solutions for Class 11 Maths Chapter 5 Exercise 5.2 below.NCERT Solutions for Class 11 Maths Chapter 5 Exercise 5.2 Overview
NCERT Solutions for Class 11 Maths Chapter 5 Exercise 5.2 focuses on Linear Inequalities , an essential concept in algebra. In this exercise, students are introduced to various real-world scenarios where inequalities help express conditions that involve relationships between quantities. The problems in this exercise will guide students through the process of solving inequalities in one and two variables, building a foundational understanding that is crucial for further mathematical learning.About the Linear Inequalities in Class 11 Maths Exercise 5.2
Linear inequalities in Class 11 Mathematics refer to inequalities involving linear expressions. They extend the concept of linear equations but use symbols such as < , > , ≤ , or ≥ to establish relationships between variables. In Exercise 5.2, students explore both numerical and literal inequalities, which can represent constraints in various practical scenarios. For example, problems like calculating the number of items that can be bought within a budget are modeled using linear inequalities. Linear inequalities can be classified as:- Strict inequalities (e.g., < , > ) — these do not include the equality condition.
- Slack inequalities (e.g., ≤ , ≥ ) — these include the possibility of equality.
NCERT Solutions for Class 11 Maths Chapter 5 Exercise 5.2 PDF
NCERT Solutions for Class 11 Maths Chapter 5 Exercise 5.2 PDF is a useful tool that provides detailed, step-by-step solutions to each problem in the exercise. Students can download the PDF and use it as a reference to solve the exercise on their own or clarify doubts after attempting the problems. Students can use the direct link provided below to download the NCERT Solutions for Class 11 Maths Chapter 5 Exercise 5.2 PDFDownload NCERT Solutions for Class 11 Maths Chapter 5 Exercise 5.2 PDF
NCERT Solutions for Class 11 Maths Chapter 5 Exercise 5.2 Linear Inequalities
NCERT Solutions for Class 11 Maths Chapter 5 Exercise 5.2 are as follows:Solutions for Class 11 Maths Chapter 5 – Exercise 5.2
Solve the following inequalities graphically in a two-dimensional plane.
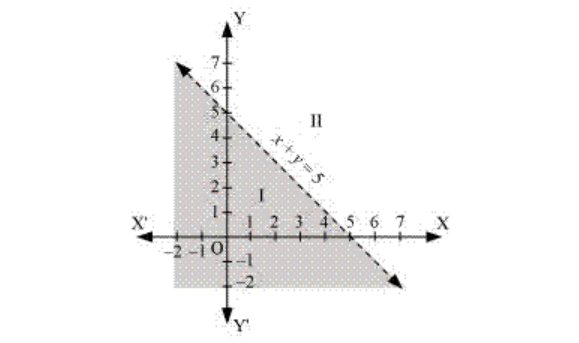
1. x + y < 5
Solution:
Given, x + y < 5 Consider,| X | 0 | 5 |
| y | 5 | 0 |
2. 2x + y ≥ 6
Solution:
Given 2x + y ≥ 6 Now, draw a solid line 2x + y = 6 in the graph (∵ 2x + y = 6 is included in the given question.) Now, consider 2x + y ≥6 Select a point (0, 0). ⇒ 2 × (0) + 0 ≥ 6 ⇒ 0 ≥ 6 (This is false.) ∴ The solution region of the given inequality is above the line 2x + y = 6. (Away from the origin.) The graph is as follows: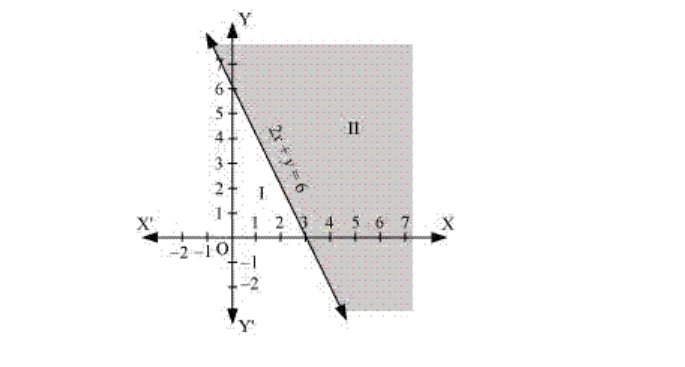
3. 3x + 4y ≤ 12
Solution:
Given, 3x + 4y ≤ 12 Now, draw a solid line 3x + 4y = 12 in the graph (∵ 3x + 4y = 12 is included in the given question.) Now, consider 3x + 4y ≤ 12 Select a point (0, 0). ⇒ 3 × (0) + 4 × (0) ≤ 12 ⇒ 0 ≤ 12 (This is true.) ∴ The solution region of the given inequality is below the line 3x + 4y = 12. (That is, the origin is included in the region.) The graph is as follows: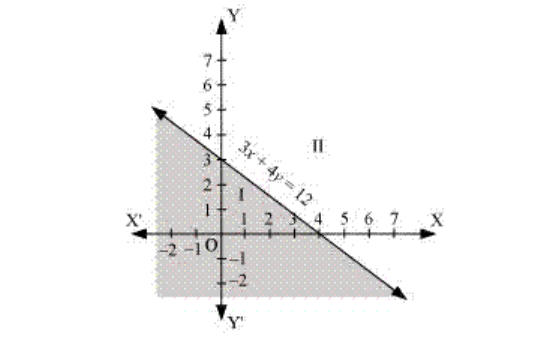
4. y + 8 ≥ 2x
Solution:
Given, y + 8 ≥ 2x Now, draw a solid line y + 8 = 2x in the graph (∵ y + 8 = 2x is included in the given question.) Now, consider y + 8 ≥ 2x Select a point (0, 0). ⇒ (0) + 8 ≥ 2 × (0) ⇒ 0≤ 8 (This is true.) ∴ The solution region of the given inequality is above the line y + 8 = 2x. (That is, the origin is included in the region.) The graph is as follows: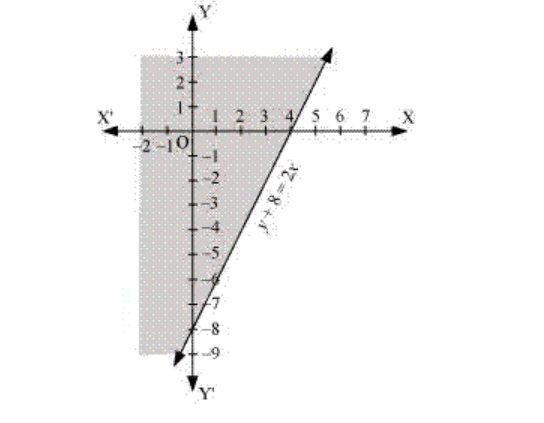
5. x – y ≤ 2
Solution:
Given, x – y ≤ 2 Now, draw a solid line x – y = 2 in the graph (∵ x – y = 2 is included in the given question.) Now, consider x – y ≤ 2 Select a point (0, 0). ⇒ (0) – (0) ≤ 2 ⇒ 0 ≤ 2 (This is true.) ∴ The solution region of the given inequality is above the line x – y = 2. (That is, the origin is included in the region.) The graph is as follows: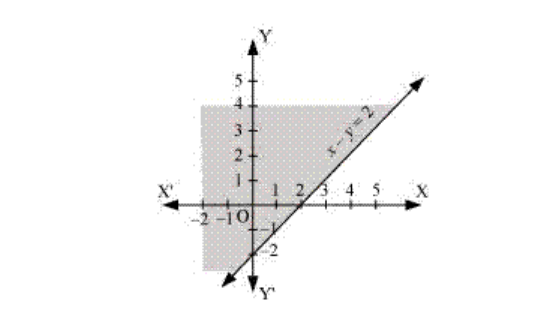
6. 2x – 3y > 6
Solution:
Given, 2x – 3y > 6 Now, draw a dotted line 2x – 3y = 6 in the graph (∵ 2x – 3y = 6 is excluded in the given question.) Now, consider 2x – 3y > 6 Select a point (0, 0). ⇒ 2 × (0) – 3 × (0) > 6 ⇒ 0 > 6 (This is false.) ∴ The solution region of the given inequality is below the line 2x – 3y > 6. (Away from the origin.) The graph is as follows: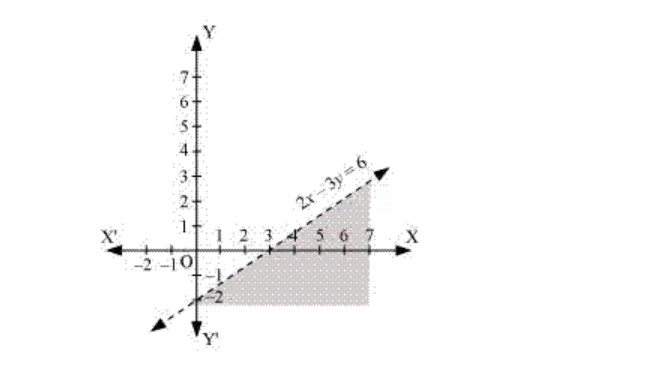
7. – 3x + 2y ≥ – 6
Solution:
Given, – 3x + 2y ≥ – 6 Now, draw a solid line – 3x + 2y = – 6 in the graph (∵– 3x + 2y = – 6 is included in the given question.) Now, consider – 3x + 2y ≥ – 6 Select a point (0, 0). ⇒ – 3 × (0) + 2 × (0) ≥ – 6 ⇒ 0 ≥ – 6 (This is true.) ∴ The solution region of the given inequality is above the line – 3x + 2y ≥ – 6. (That is, the origin is included in the region) The graph is as follows: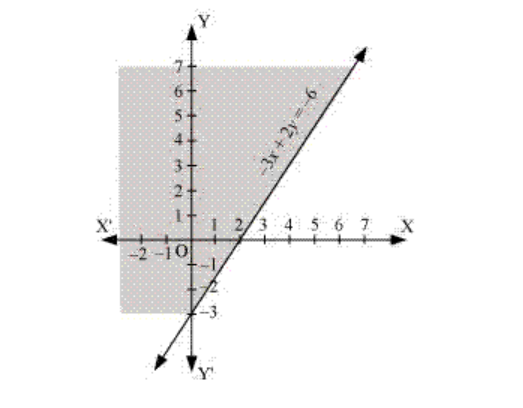
8. y – 5x < 30
Solution:
Given, y – 5x < 30 Now, draw a dotted line 3y – 5x = 30 in the graph (∵3y – 5x = 30 is excluded in the given question.) Now, consider 3y – 5x < 30 Select a point (0, 0). ⇒ 3 × (0) – 5 × (0) < 30 ⇒ 0 < 30 (This is true.) ∴ The solution region of the given inequality is below the line 3y – 5x < 30. (That is, the origin is included in the region.) The graph is as follows: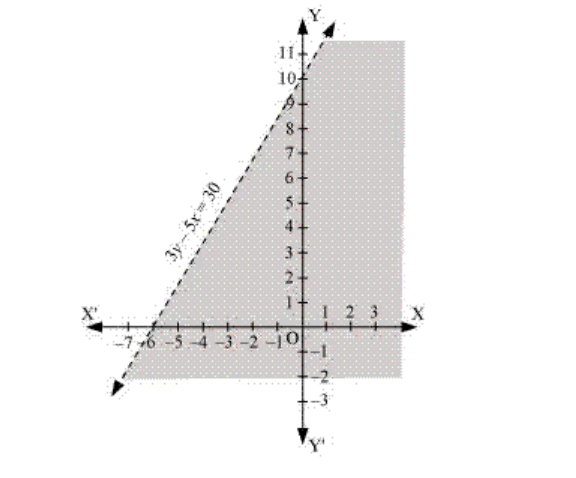
Benefits of NCERT Solutions for Class 11 Maths Chapter 5 Exercise 5.2
The NCERT Solutions for Class 11 Maths Chapter 5 Exercise 5.2 offer several benefits for students:- Concept Clarity : These solutions break down complex topics into understandable steps, helping students master the concepts of linear inequalities.
- Effective Exam Preparation : With solutions aligned to the NCERT syllabus, this resource is essential for students preparing for the CBSE exams. It provides clarity on how to solve linear inequalities efficiently, an important skill for the mathematics paper.
- Step-by-Step Guidance : Each solution is explained in detail, ensuring students understand not only the final answer but also the process that leads to it.
- Time Management : By providing quick and accurate solutions, students can focus more on practicing and less on figuring out the method.
NCERT Solutions for Class 11 Maths Chapter 5 Exercise 5.2 FAQs
How can I use NCERT Solutions for Class 11 Maths Chapter 5?
What is the importance of solving Exercise 5.2 in Linear Inequalities?
How do the NCERT Solutions for Chapter 5 assist in exam preparation?
Can I access NCERT Solutions for Class 11 Maths Chapter 5 Exercise 5.2 anytime?