
What Are Types of Correlation? Meaning and Formula
Check the types of correlation and their significance in data analysis. Learn how to interpret relationships between variables and calculate the correlation coefficient with a simple formula.
Understanding the relationships between variables is crucial for drawing meaningful conclusions in data analysis and statistics. One of the most commonly used tools for this purpose is correlation. It helps identify how two or more variables are related, whether they move in the same direction, in opposite directions, or show no relationship at all. Whether you're conducting scientific research, analyzing economic trends, or forecasting financial markets, knowing how variables correlate with each other can help make informed decisions.
In this blog, we'll check the concept of correlation, its different types, and how to calculate it using the its formula.What is Correlation?
Correlation is a statistical measure that describes the strength and direction of a relationship between two or more variables. It tells us how one variable changes to another. In simpler terms, it answers the question: "If one variable changes, how does the other variable react?" For instance, there may be a positive correlation between the amount of time a student spends studying and their exam scores. This would mean that as the time spent studying increases, the exam scores are likely to increase as well. Correlation is measured on a scale from -1 to +1:- A correlation of +1 indicates a perfect positive relationship.
- A correlation of -1 indicates a perfect negative relationship.
- A correlation of 0 indicates no linear relationship.
Types of Correlation
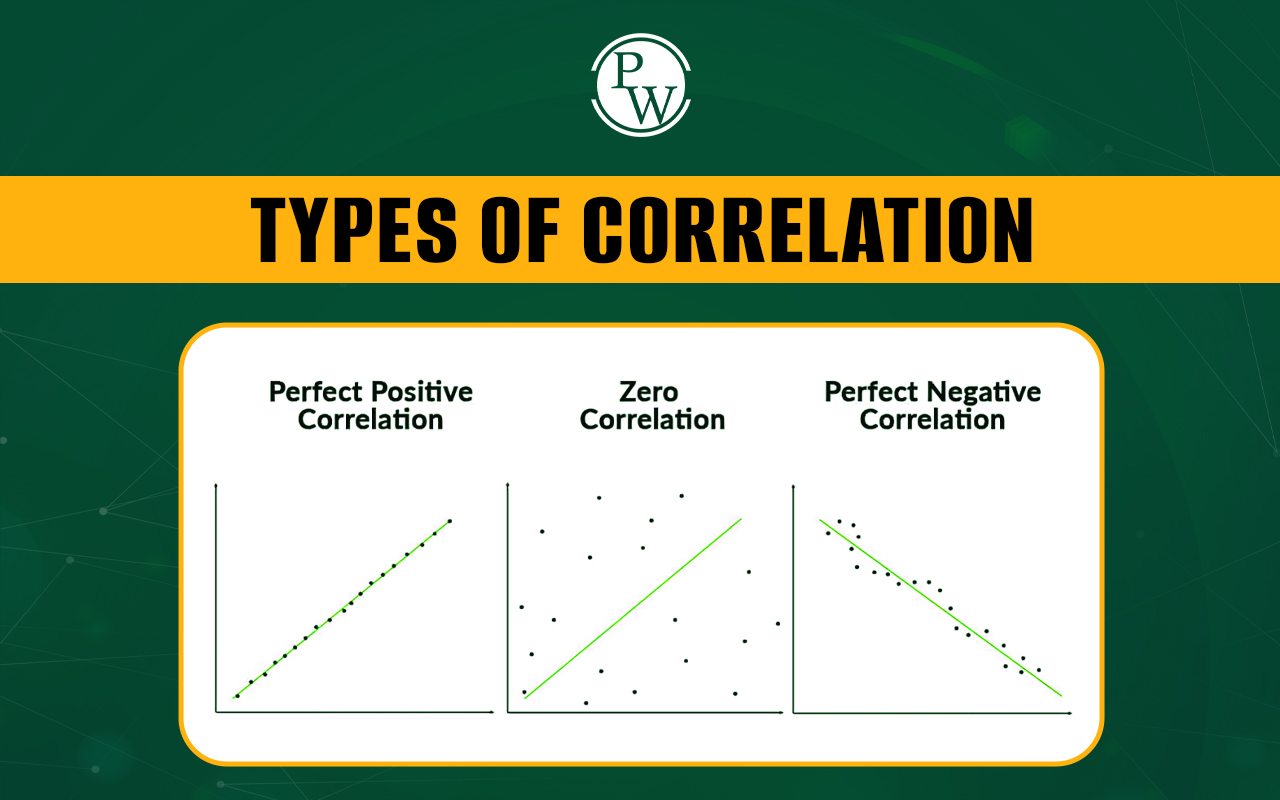
Correlation can be classified into several types, depending on the direction and strength of the relationship between the variables:1. Positive Correlation
A positive correlation occurs when two variables move in the same direction. That is, as one variable increases, the other also increases, and vice versa. A classic example is the relationship between height and weight as a person’s height increases, their weight generally increases as well.2. Negative Correlation
Negative correlation refers to a situation where two variables move in opposite directions. In other words, as one variable increases, the other decreases. An example would be the relationship between the price of a product and its demand — as the price increases, demand typically decreases.3. No Correlation
When there is no correlation between two variables, changes in one variable do not lead to predictable changes in the other. For example, the relationship between shoe size and intelligence does not show any correlation.4. Perfect Positive Correlation
This occurs when two variables are perfectly correlated, meaning that for every unit change in one variable, there is a corresponding unit change in the other. A correlation coefficient of +1 represents a perfect positive correlation.5. Perfect Negative Correlation
A perfect negative correlation occurs when two variables move in exactly opposite directions. For every increase in one variable, there is a corresponding decrease in the other. This type of it has a coefficient of -1 .6. Spurious Correlation
Spurious correlation refers to a relationship between two variables that appears to be causal but is actually due to the effect of a third variable. Such relationships may mislead researchers if not carefully examined.7. Partial Correlation
Partial correlation helps measure the relationship between two variables while controlling for the influence of one or more additional variables. This allows researchers to understand the direct relationship between the two variables of interest.Formula for Correlation
It is a statistical measure that evaluates the strength and direction of the relationship between two variables. There are several formulas used to calculate correlation coefficients, each suited for different types of data and relationships. Here’s a summary of the key formulas for it:Pearson Correlation Coefficient
The Pearson correlation coefficient (denoted as r ) measures the linear relationship between two continuous variables. The formula is: Where: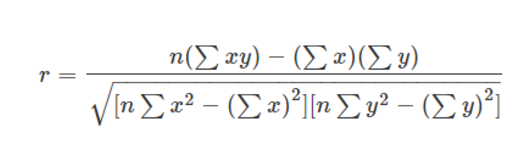
- n is the number of data points,
- ∑xy is the sum of the product of the paired scores,
- ∑x is the sum of the x-values,
- ∑y is the sum of the y-values,
- ∑x2 is the sum of the squares of the x-values,
- ∑y2 is the sum of the squares of the y-values.
Sample Correlation Coefficient
The sample correlation coefficient is similar to the population correlation but used for sample data. It can be expressed as:- Sxy = sample covariance between X and Y
- Sx = sample standard deviation of X
- Sy = sample standard deviation of Y
What is Correlation FAQs
How is the strength of correlation interpreted?
The strength of correlation is determined by the correlation coefficient (r):
+1: Perfect positive correlation
-1: Perfect negative correlation
0: No correlation
Values closer to +1 or -1 indicate a stronger relationship, while values near 0 indicate a weaker relationship.
What is Pearson’s correlation coefficient used for?
Pearson’s correlation coefficient measures the linear relationship between two continuous variables. It’s commonly used in fields like finance, economics, and social sciences to assess how closely related two variables are.
Can correlation coefficients be used for non-linear relationships?
No, Pearson’s correlation coefficient specifically measures linear relationships. For non-linear relationships, other methods like Spearman’s rank correlation or Kendall’s tau should be used to assess the strength and direction of association.
What are the limitations of using correlation?
Correlation has several limitations:
It does not imply causation.
It only measures linear relationships (in the case of Pearson’s coefficient).
Outliers can significantly affect the correlation coefficient.
Spurious correlations can mislead analysis if underlying variables are not accounted for.
🔥 Trending Blogs
Talk to a counsellorHave doubts? Our support team will be happy to assist you!

Check out these Related Articles


Join 15 Million students on the app today!

Free Learning Resources
PW Books
Notes (Class 10-12)
PW Study Materials
Notes (Class 6-9)
Ncert Solutions
Govt Exams
Our Other Websites
Class 6th to 12th Online Courses
Govt Job Exams Courses
UPSC Coaching
Defence Exam Coaching
Gate Exam Coaching
Other Exams
Know about Physics Wallah
Physics Wallah is an Indian edtech platform that provides accessible & comprehensive learning experiences to students from Class 6th to postgraduate level. We also provide extensive NCERT solutions, sample paper, NEET, JEE Mains, BITSAT previous year papers & more such resources to students. Physics Wallah also caters to over 3.5 million registered students and over 78 lakh+ Youtube subscribers with 4.8 rating on its app.
We Stand Out because
We provide students with intensive courses with India’s qualified & experienced faculties & mentors. PW strives to make the learning experience comprehensive and accessible for students of all sections of society. We believe in empowering every single student who couldn't dream of a good career in engineering and medical field earlier.
Our Key Focus Areas
Physics Wallah's main focus is to make the learning experience as economical as possible for all students. With our affordable courses like Lakshya, Udaan and Arjuna and many others, we have been able to provide a platform for lakhs of aspirants. From providing Chemistry, Maths, Physics formula to giving e-books of eminent authors like RD Sharma, RS Aggarwal and Lakhmir Singh, PW focuses on every single student's need for preparation.
What Makes Us Different
Physics Wallah strives to develop a comprehensive pedagogical structure for students, where they get a state-of-the-art learning experience with study material and resources. Apart from catering students preparing for JEE Mains and NEET, PW also provides study material for each state board like Uttar Pradesh, Bihar, and others
Copyright © 2026 Physicswallah Limited All rights reserved.