Standard Deviation: Definition, Formula, Learn How to Calculate
Share
Standard deviation formula is a special math trick that helps us understand how spread out numbers are in a group. It's like checking how much your friends' test scores differ from the class average. This trick is called the standard deviation method.
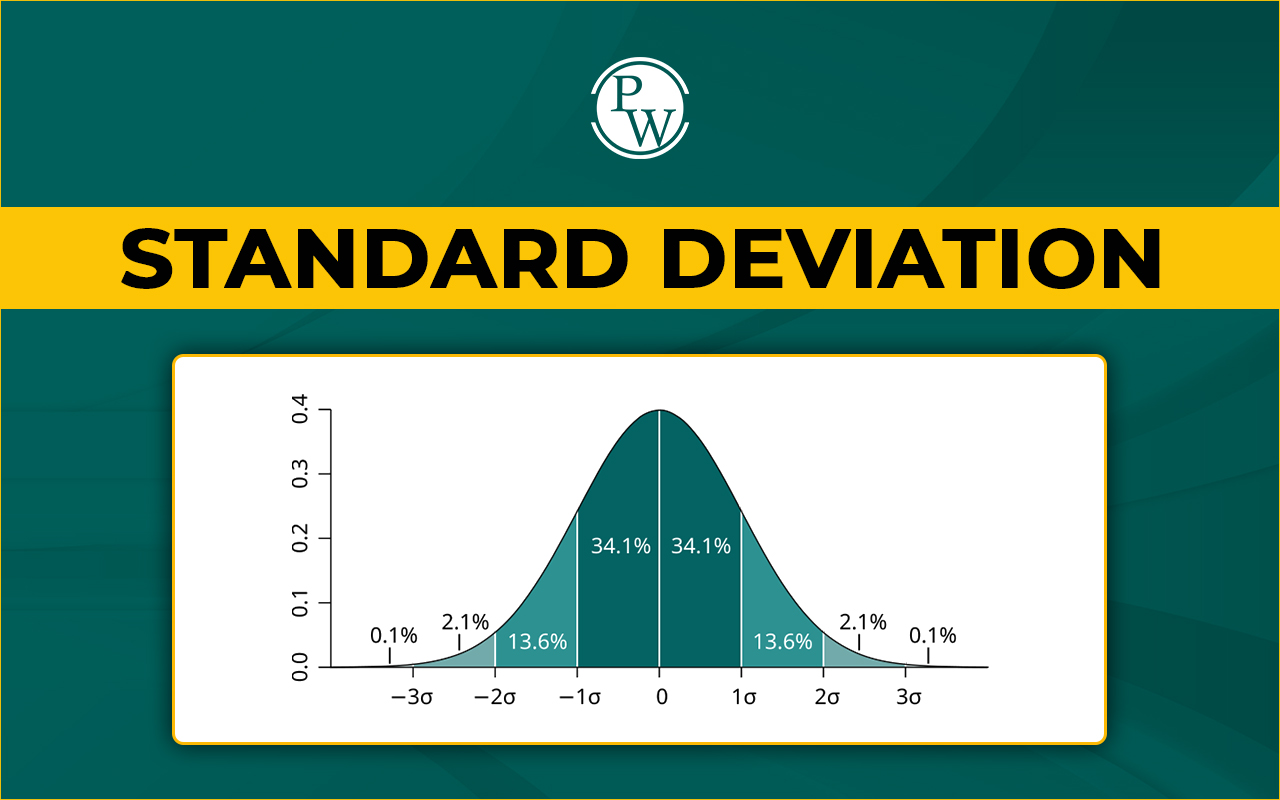
A low standard deviation indicates that the data points are closely clustered around the mean, while a high standard deviation suggests that the data points are more spread out. Standard deviation is widely used in various fields such as finance, science, and engineering to assess risk, variability, and consistency. It is particularly useful because it is expressed in the same units as the original data, making it easy to interpret. Understanding the standard deviation helps in making more informed decisions based on data variability.What is Standard Deviation?
What do you mean by standard deviation? Standard deviation indicates the amount of variation or dispersion of a set of data values from the mean. It provides insight into the "typical" deviation of data points from the average. As a widely used measure of variability, standard deviation can be expressed in the same units as the data itself. Similar to variance, the standard deviation is small when data points are closely clustered around the mean, whereas it is large if the data points are more spread out. It calculates the degree to which individual values differ from the mean. Since it takes all values into account, even a single change in the data can affect the standard deviation. While it is independent of the data's origin, it is sensitive to scale. Standard deviation is also particularly useful in advanced statistical analyses.Read More - Pythagoras Theorem: Formula, Proof, and Solved Examples
Why Is Standard Deviation Important?
When we look at a group of numbers, like test scores or heights of plants, it's helpful to know if they're mostly similar or very different. That’s where the standard deviation method helps. It tells us how much the numbers move away from the average.
Scientists, teachers, and even players use this trick to understand things better. And the best part? You can learn this too with the help of the standard deviation formula.
What is Standard Deviation Formula?
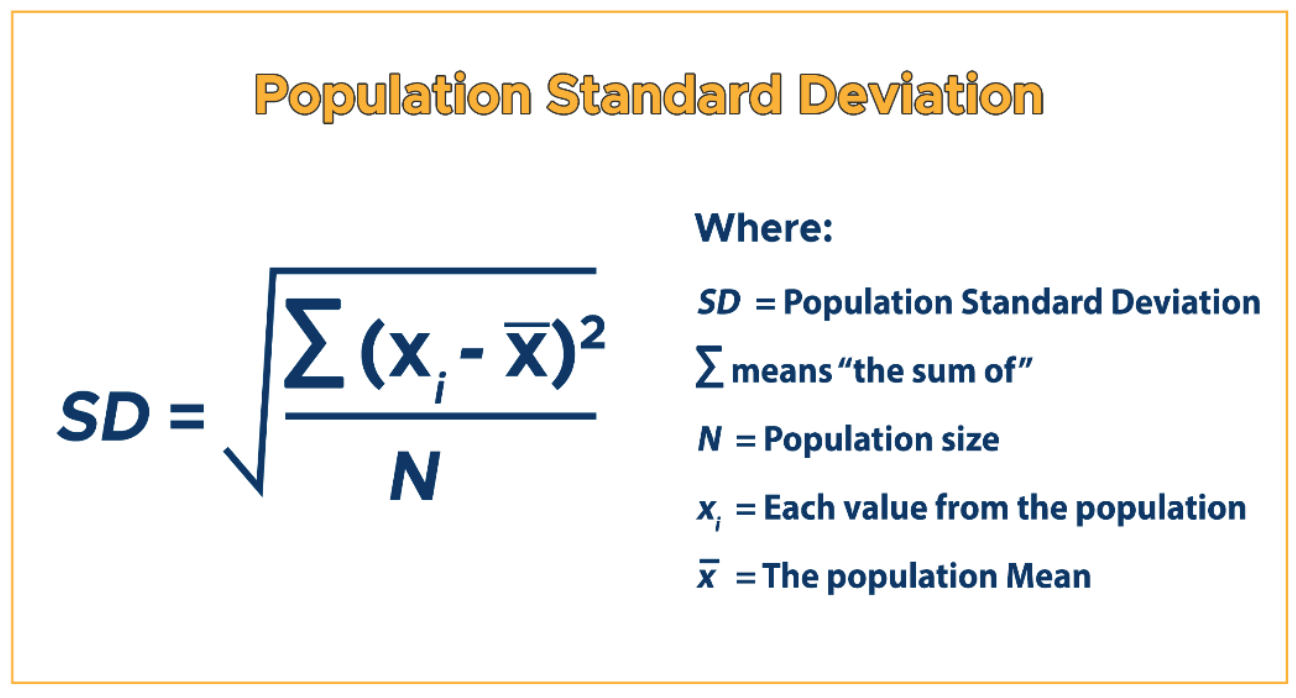
The formula for standard deviation depends on whether you are calculating it for a sample or an entire population.For a Population:
The formula for the standard deviation of a population is:
- Σ\ is the population standard deviation
- N is the total number of data points in the population
- Xi represents each individual data point
- μ is the population mean (average)
- s is the sample standard deviation
- n is the number of data points in the sample
- xi represents each individual data point
- xˉ\}xˉ is the sample mean (average)
What is the Formula to Find Standard Deviation for Grouped Data?
In grouped data, we organize numbers in classes (like ages 5–10, 11–15). Here’s how the formula for standard deviation works:
-
Use midpoints for each class
-
Subtract mean from midpoints
-
Square the result and multiply by how many times that class appears (frequency)
-
Add them up
-
Divide and take the square root
This version of the standard deviation equation helps when we deal with big groups.
How to Calculate Standard Deviation?
Let’s break it down in fun steps using the standard deviation formula: The key difference between the two formulas is that in the sample formula, we divide by n−1n - instead of n. This correction is known as Bessel's correction and helps to provide a more accurate estimate of the population standard deviation when using a sample.- Find the mean: Add up all the data points and divide by the total number of data points (for a population) or the sample size (for a sample).
- Calculate the differences from the mean: Subtract the mean from each data point.
- Square the differences: Square each of the differences obtained in step 2.
- Sum the squared differences: Add up all the squared differences.
- Find the average of the squared differences: For a population, divide the sum of squared differences by the total number of data points. For a sample, divide by one less than the sample size (to apply Bessel’s correction).
- Take the square root: Finally, take the square root of the result to get the standard deviation. This value tells you how spread out the data is from the mean.
Read More - Perimeter of Rectangle: Definition, Formulas, Solved Examples
Standard Deviation by the Actual Mean Method
This method involves directly calculating the mean of the data and then finding the standard deviation. Steps:- Find the mean (actual mean) by adding all the data points together and dividing by the total number of data points.
- Calculate the mean and subtract the mean from each data point.
- Square the differences of square each of the differences calculated in step 2.
- Find the average of the squared differences, sum all the squared differences, and divide by the number of data points (for a population) or by n−1n-1n−1 (for a sample).
- The square root of the average squared differences is the standard deviation.
This standard deviation method helps in faster calculations.
Standard Deviation by the Assumed Mean Method
In this method, an assumed mean is selected (usually a value close to the actual mean) to simplify calculations. The differences between the data points and the assumed mean are calculated and then used to find the standard deviation. Steps:- Choose an Assumed Mean (A): Select a value close to the actual mean. This simplifies the calculation process, especially for large datasets.
- Calculate the Differences from the Assumed Mean: Subtract the assumed mean from each data point to get the deviations.
- Multiply the Deviations by the Frequency (for grouped data): If dealing with grouped data, multiply the deviations by the frequency of each data point (or class).
- Find the Sum of Squared Differences: Square each deviation and multiply by the frequency, then sum these values.
- Apply the Formula for Standard Deviation: Divide the sum of squared differences by the total number of data points (for a population) or by n−1n-1n−1 (for a sample) and take the square root of the result.
Read More - Numbers: Definition, Types, and Properties
Standard Deviation of Grouped Data
For grouped data, the data is organized into classes, and we calculate the standard deviation formula for grouped data using the class midpoints and frequencies. Steps:- Find the Class Midpoints: For each class interval, calculate the midpoint by adding the class's lower and upper bounds and dividing by 2.
- Calculate the deviation from the mean: Subtract the mean (or assumed mean) from each class midpoint to get the deviation.
- Square the Deviations: Square each of the deviations calculated in step 2.
- Multiply the Squared Deviations by the Frequency: Multiply the squared deviations by the frequency of each class.
- Find the sum of the products: Sum the products of squared deviations and frequencies.
- Calculate the Standard Deviation: For grouped data, divide the sum of the squared deviations (weighted by frequency) by the total frequency (N) or n−1n-1n−1 (for a sample). Take the square root of the result to get the standard deviation.
Standard Deviation in Real Life
Do you know what do you mean by standard deviation when applied in real life? It’s like this:
-
In school: Teachers use it to see which students need more help.
-
In sports: Coaches use it to track performance differences.
-
In weather: Scientists use it to understand how much temperatures change.
All of them use the standard deviation equation to make smart decisions.
Easy Way to Remember the Formula to Find Standard Deviation
Here’s a rhyme to help you remember the formula to find standard deviation: “Mean, subtract, square it tight, Add them all, and root it right!”
You can use this to never forget the standard deviation formula. The more you practice, the easier it becomes. Join Online Class for Kids Now!
Standard Deviation FAQs
How do you calculate the standard deviation of 5, 5, 9, 9, 9, 10, 5, 10, 10?
What is Standard Deviation?
Why is standard deviation important?
What does a low standard deviation mean?