Classification Of Elements, Newlands Octave Rule And Lothar Meyer'S Curve, JEE Main 2024
Newlands Octave Rule : The quest to unravel the complexities of the elemental world has been a journey marked by visionary chemists who endeavored to discern patterns and order among the multitude of chemical elements. In the mid-19 th century, two notable figures, John Newlands and Lothar Meyer, made significant contributions to the classification of elements, each offering unique perspectives on the relationships between these fundamental building blocks of matter.
Newlands, with his Octave Rule, and Meyer, with his Curve, embarked on separate yet interconnected journeys that enriched the understanding of periodicity. As we explore the realms of Newlands' Octave Rule and Meyer's Curve, we navigate through the historical landscape of elemental classification, witnessing the intellectual endeavors that paved the way for the modern periodic table.
Newlands Octave Rule (A Musical Analogy for Elements)
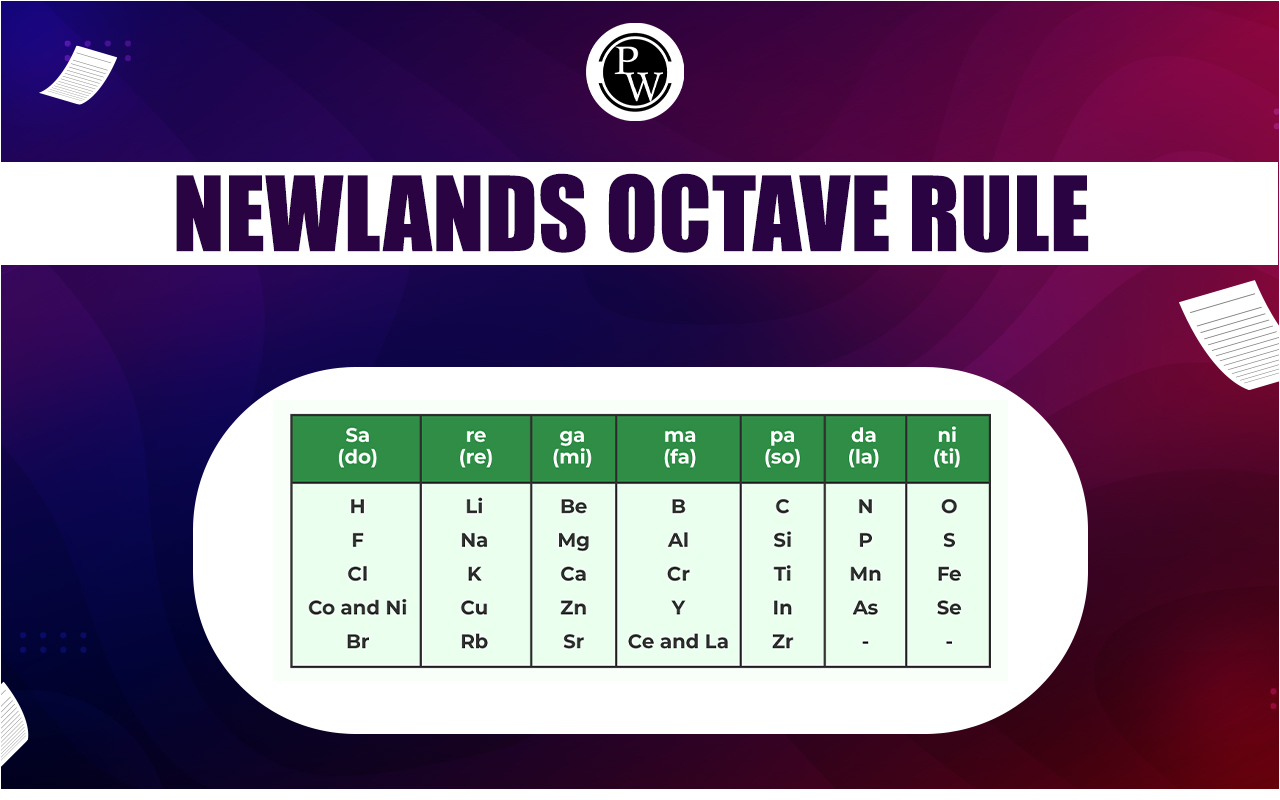
Newlands Octave Rule (A Musical Analogy for Elements) : John Newlands, a British chemist, proposed the Octave Rule. Inspired by the musical octave. Newlands noticed a recurring pattern among elements when arranged by increasing atomic masses. Every eighth element displayed similar properties, akin to the musical notes in an octave .
Although met with skepticism initially, Newlands' Octave Rule offered a novel perspective on periodicity, suggesting a rhythmic order in the properties of elements. Despite its limitations, the Octave Rule laid the groundwork for future advancements in the classification of elements.
(i) He arranged the elements in the increasing order of their atomic mass and observed that the properties of every 8 th element was similar to the 1 st element. (like in the case of musical vowels notation)
(ii) At that time inert gases were not known.
(iii) The properties of Li are similar to 8 th element i.e. Na and Be are similar to Mg and so on.

Drawbacks (Limitations) of Newlands Octave Rule
1. This rule is valid only upto Ca because after Ca, due to the presence of the d-block element, there is a difference of 18 elements instead of 8 elements.
2. After the discovery of Inert gas and included in the periodic table it became the 8 th element from Alkali metal, so the law had to be dropped out.
Lothar Meyer's Curve
Lothar Meyer's Curve : Lothar Meyer, a German chemist, independently ventured into the realm of elemental classification, focusing on the relationship between atomic volumes and atomic weights. In 1869, Meyer unveiled a graphical representation known as Lothar Meyer's Curve, demonstrating periodic trends among elements. The curve revealed a systematic pattern where elements with similar properties occupied analogous positions, providing a visual confirmation of periodicity. Meyer's Curve, though initially overshadowed, played a pivotal role in shaping the concept of periodic trends and contributed to the eventual establishment of the modern periodic table.
(i) He plotted a curve between atomic weight and atomic volume of different elements.
(ii) The following observations can be made from the curve-
(a) Most electropositive elements i.e. alkali metals (Li, Na, K, Rb, Cs etc.) occupy the peak positions on the curve.
(b) Less electropositive i.e. alkaline earth metal (Be, Mg, Ca, Sr, Ba) occupy the descending positions on the curve.
(c) Metalloids (Si, As, Te, etc.) and transition metals occupy the bottom part of the curve .
(d) Most electronegative i.e., halogens (F, Cl, Br, I) occupy the ascending positions on the curve .

Important Note : Elements having similar properties occupy similar positions on the curve. On the basis of the curve Lother Meyer proposed that the physical properties of the elements are periodic function of their atomic weight and this become the base of Mendeleev’s periodic table.
Periodic function
Periodic function : When the elements are arranged in the increasing order of their atomic weight,
elements having similar properties gets repeated after a regular interval.
While Newlands' Octave Rule and Meyer's Curve were conceived independently, they share a common
objective: to discern order amid elemental diversity. Newlands sought harmony in the periodicity of
elements, drawing inspiration from music, while Meyer visualized the periodic trends through a graphical
representation. Both approaches contributed valuable insights, with Newlands sparking the idea of
periodicity and Meyer providing a visual confirmation through his Curve.
Classification of Elements FAQs
Q.1 How was Newlands' Octave Rule received by the scientific community, and what were its limitations?
Q.2 : Who is Lothar Meyer, and what is Meyer's Curve in the context of the classification of elements?
Q.3 : How did Meyer's Curve contribute to the development of the periodic table?
Q.4 How do Newlands' and Meyer's contributions compare with later developments in the classification of elements?
Q.5 : What is Newlands' Octave Rule, and how did John Newlands propose to classify elements using this concept?