

Mode
Statistics of Class 10
A mode is one of the values of the measure of central tendency. This value gives us a rough idea of which items in the data set occur most often. For example, you know that a college offers ten different courses for students. Now, the course with the highest number of registered students will be counted from them as the mode of the data we mentioned (the number of students taking each course). Overall, the mode tells us the highest frequency of any given item in the data set.
There are many uses in real life, and the importance of using the mode value. There are many aspects in which simply finding the mean (or median) will not work. For example, look at the example above. Therefore, to find the highest number of students enrolled in a course, searching for any mean or median will not work. Therefore, in such cases, we tend to use mode.
| Table of Content |
What is Mode in Statistics?
Mode means the value or number that occurs most frequently in the data set. Sometimes we may need to find a value that occurs more often in a dataset. In most of cases, we find the mode for the data set. There may or may not be a modal value for a given data set. There may be no mode for data without any repeating values. Also, we can find data with only one mode, two modes, three modes, or multiple modes. This depends on the data file in question.
A list can be unimodal, bimodal, trimodal, or multimodal, depending on the number of modes.
- Unimodal List: A list of given data with only one mode is called a unimodal list.
- Bimodal List: A list of given data with two modes is called a bimodal list.
Mode Formula
In statistics, the mode formula class 10 calculates a given data set mode or modal value. It is defined as the value occurring in the given set. This means the value or number in a data set that has a high frequency is called modal value or mode. It is the three measures of central tendency, apart from mean and median.
Mode for ungrouped data is found by selecting the most frequent item on the list. Now, for any given date range, let us take 'h' is the size of the class interval, 'L' is the lower limit of the modal class, '(f)m' is the frequency of the modal class, '(f) 1 'is the frequency of the class preceding and '(f) 2 ' is the frequency of the class succeeding in the modal class. Therefore, the modal class is the data interval which has the highest frequency. So, the mode can be calculated by the formula:
Mode Formula of Ungrouped Data
For finding the mode for ungrouped data, arrange the data values in ascending or descending order and then find the repeated values and their frequencies. The highest frequency in the observation is the modal value for the given data is referred to here as the modal value.
Mode Formula of Grouped Data
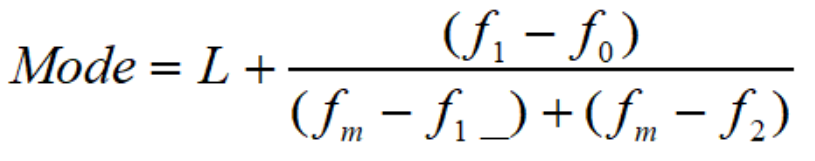
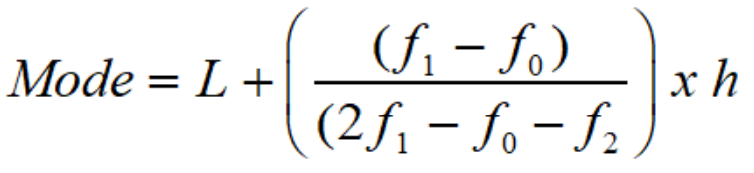
In the case of a grouped frequency distribution, it is impossible to calculate the mode by simply looking at the frequency. To determine the mode of the data in such cases, we calculate the modal class. Mode lies inside the modal class. The formula gives the data mode:
Where,
l = lower limit of the modal class
h = size of the class interval
f 1 = frequency of the modal class
f 0 = frequency of the class preceding the modal class
f 2 = frequency of the class succeeding the modal class
Merits of Mode
- It can be easily understood and is easy to calculate.
- It is not affected by extreme values and can be found by inspection is some cases.
- It can be measured even if open - end classes and can be represented graphically.
Demerits of Mode
- It is ill - fined. It is not always possible to find a clearly defined mode.
- It is not based upon all the observation.
- It is not capable of further mathematical treatment. it is after indeterminate.
- It is affected to a greater extent by fluctuations of sampling.
Uses of Mode
Mode is the average to be used to find the ideal size, e.g., in business forecasting, in manufacture of ready-made garments, shoes etc.
Solved Example
Q1. The wickets taken by a bowler in 10 cricket matches are as follows: 2, 6, 4, 5, 0, 2, 1, 3, 2, 3. Find the mode of the data.
Ans. Clearly, 2 is the number of wickets taken by the bowler in the maximum number (i.e., 3) of matches. So, the mode of the distribution is 2.
Formula for Calculating Mode:
We have:
where
f = lower limit of the modal class,
f 1 = frequency of the modal class;
f 0 = frequency of the class preceding the modal class;
f 2 = frequency of the class succeeding the modal class;
h = width of the class interval (assuming all class width to be equal)
Q2. For what value of x, the mode of the following data is 7 : 3, 5, 6, 7, 5, 4, 7, 5, 6, x, 8, 7.
Ans.
| Variate | 3 | 4 | 5 | 6 | 7 | 8 |
| Frequency | 1 | 1 | 3 | 2 | 3 | 1 |
5 and 7 both have maximum frequency, but mode = 7. So, x = 7.
Frequently Asked Question (FAQs)
Q1. How To Find Mode Using Mode Formula?
Ans. We generally use the mode formula only in the case of grouped data which involves the following steps:
- Step 1: Locate the modal class.
- Step 2: Then, check for the frequency of the modal class, which is represented as f1f1 or fmfm .
- Step 3: Find the size of the class interval, which is represented as h.
- Step 4: Find the lower class limit of the modal class, that is l.
- Step 5: Identify f0f0 (the frequency of the class preceding the modal class) and f2f2 (the frequency of the succeed class in the modal class)
- Step 6: Then, apply the mode formula
Q2. How to calculate mode?
Ans. To simply find the mode, put the numbers in order from lowest to greatest and then count how many times each number occurs. The number that appears the most is the mode.
Q3. What is the mode in maths terms?
Ans. The mode in maths term is the value that occurs most often. It is the only average that can have no value, one value, or more than one value. When finding the mode, it helps to order the numbers first.
Q4. How is the mode used in real life?
Ans. One of the owners of the factory lives in the city, and his salary is in the millions of dollars. If you used a measure like the average to compare salaries in the town, the owner's income would throw the numbers off significantly. This is where mode measurement can be helpful in the real world.