

Coefficient of Determination Formula: R-Squared Calculation Guide

In statistical analysis, the Coefficient of Determination , often referred to as R-squared, plays a crucial role in predicting and explaining future outcomes within a model. This metric serves as a valuable tool for assessing the accuracy of a model. In this article, we will delve into a comprehensive exploration of the definition, formula, and properties of the coefficient of determination.
Coefficient of Determination Definition
The coefficient of determination, also known as R-squared (R²), is a metric that measures the proportion of variance in the dependent variable that can be predicted from the independent variable(s). It provides insights into the level of variability within a given dataset. Some important properties and characteristics of the coefficient of determination include:
Range: R-squared values range from 0 to 1. An R² of 0 indicates that the dependent variable cannot be predicted from the independent variable(s), while an R² of 1 means that the dependent variable can be predicted from the independent variable(s) without any error.
Relationship with Correlation: R² is equal to the square of the correlation coefficient (r) in linear regression. This means that the relationship between R² and r is a square relationship.
Interpretation: When R² falls between 0 and 1, it indicates the extent to which the dependent variable can be predicted. For example, an R² of 0.10 means that 10 percent of the variance in the dependent variable is predictable from the independent variable(s). Similarly, an R² of 0.20 means that 20 percent of the variance is predictable, and so on.
Goodness of Fit: R² is commonly used to assess whether a model is a good fit for the given dataset. The higher the R² value, the better the model is at explaining the variance in the dependent variable.
Field-Specific Expectations: The acceptable range of R² can vary depending on the field of study and the specific application. In fields like rocket science, a high R² (closer to 100%) may be expected, but in practice, R² is always greater than 0 due to the nature of linear regression.
In summary, the coefficient of determination (R²) is a valuable tool for evaluating the predictive power of a model and understanding the proportion of variance in the dependent variable that can be explained by the independent variable(s). Its interpretation can vary depending on the context and field of analysis.
The addition of a new predictor variable can lead to an increase in the value of R², but it's important to note that this increase doesn't necessarily imply a meaningful improvement in the model's performance or predictive power. Here are some key points to consider:
R² and Model Complexity: When you add a new predictor variable to a regression model, it can increase the apparent explanatory power of the model, as indicated by the higher R² value. However, this increase may not be associated with a genuine improvement in the model's ability to predict the outcome variable.
Adjusted R²: Adjusted R² is a modified version of R² that takes into account the number of predictor variables in the model. It penalizes the inclusion of additional variables that do not significantly improve the model's performance. An increase in adjusted R² is meaningful only if it is greater than what would be expected by chance.
Multiple Linear Regression: In the context of multiple linear regression, the addition of new predictors can increase R², but it's essential to assess whether these predictors are statistically significant and whether they contribute meaningfully to the model's explanatory power.
Regression Line Equation: The equation p' = aq + r represents the regression line, where p' is the predicted value of the dependent variable p based on the independent variable q. Evaluating how well this least-squares equation predicts p involves considering the model's overall fit, statistical significance of coefficients, and the practical significance of predictors.
In summary, while the addition of a new predictor variable may lead to an increase in R², it should be done thoughtfully, taking into account statistical significance and practical relevance. Adjusted R² is a valuable metric for assessing model improvement while considering the complexity introduced by additional predictors. The goal is to build a model that not only has a high R² but also provides meaningful insights and predictions.
Also Check – Volume of a Cylinder Formula
Coefficient of Determination Formula
The coefficient of determination (R²) can be calculated using two different formulas, one based on the correlation coefficient and the other based on the sums of squares. Here are both formulas:
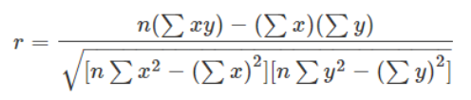
Where
n = Total number of observations
Σx = Total of the First Variable Value
Σy = Total of the Second Variable Value
Σxy = Sum of the Product of first & Second Value
Σx2 = Sum of the Squares of the First Value
Σy2 = Sum of the Squares of the Second Value
Thus, the coefficient of of determination = (correlation coefficient)2 = r2
Formula 2:
The formula of coefficient of determination is given by:
R2 = 1 – (RSS/TSS)
Where,
R2 = Coefficient of Determination
RSS = Residuals sum of squares
TSS = Total sum of squares
Also Check – Factors and multiples Formula
Properties of Coefficient of Determination
The significance of the coefficient of determination (R²) in a clear and concise manner. Here's a recap:
Predictive Assessment: R ² allows us to assess how much one variable can be predicted from another. It serves as a measure of how well predictions can be made based on the provided data.
Clarity of Predictions: R ² helps us gauge the clarity and reliability of predictions. A higher R² indicates that predictions are more reliable, as a larger portion of the variance in the dependent variable is accounted for.
Explained Variation Ratio: R ² quantifies the ratio of explained variation to total variation. It offers insights into how much of the total variability in the dependent variable is explained by the independent variable(s).
Strength of Linear Association: R ² acts as an indicator of the strength of the linear association between variables. A high R ² suggests a strong linear relationship, while a low R ² indicates a weaker connection.
Proximity to Regression Line: R ² 's value reflects the proximity of observed values to the regression line. When R ² is close to 1, it signifies that observed values closely align with the regression line. Conversely, when R ² nears 0, values deviate further from the regression line.
Determining Variable Associations: R² is instrumental in assessing the strength of associations between different variables, aiding in data analysis and decision-making.
In essence, R² serves as a valuable tool for evaluating the predictive power, goodness of fit, and association strength in regression models, ultimately facilitating informed data-driven decisions.
Also Check – Rational Number Formula
Steps to Find the Coefficient of Determination
Calculate 'r', the correlation coefficient.
Square the calculated 'r' value.
Convert the squared value into a percentage.
Coefficient of Determination Formula FAQs
Q1 How is R^2 computed?
Q2 How do you calculate the coefficient of determination?
Q3 What constitutes a good coefficient of determination?
Q4 Is the coefficient of determination equivalent to R^2?
Q5 What does R^2 indicate?