RS Aggarwal Solutions for Class 10 Maths Chapter 9 Exercise 9.6
Share

RS Aggarwal Solutions for Class 10 Maths Chapter 9 Exercise 9.6: RS Aggarwal Solutions for Class 10 Maths Chapter 9 Exercise 9.6 focus on cumulative frequency distribution and how to draw cumulative frequency curves, called ogives.
They help students learn how to plot and understand ogives step by step. By practicing these exercises, students can get better at analyzing and visualizing data, which is important for their math exams. These solutions are a great resource for understanding cumulative frequency and its uses in statistics.RS Aggarwal Solutions for Class 10 Maths Chapter 9 Exercise 9.6 Overview
These solutions for RS Aggarwal Class 10 Maths Chapter 9 Exercise 9.6 were created by subject experts of Physics Wallah. This exercise teaches about cumulative frequency distribution and how to draw cumulative frequency curves, called ogives. The solutions explain each step clearly and simply, helping students learn how to plot and understand ogives. By practicing these exercises, students can improve their skills in analyzing and visualizing data, which is important for their exams. These expert-prepared solutions are a great resource for understanding cumulative frequency and its uses in statistics.RS Aggarwal Solutions for Class 10 Maths Chapter 9 Exercise 9.6 PDF
The PDF link for RS Aggarwal Solutions for Class 10 Maths Chapter 9 Exercise 9.6 is available below. By using this PDF, students can easily understand how to plot and interpret cumulative frequency curves. This resource is very useful for improving data analysis and visualization skills, helping students prepare effectively for their exams.RS Aggarwal Solutions for Class 10 Maths Chapter 9 Exercise 9.6 PDF
RS Aggarwal Solutions for Class 10 Maths Chapter 9 Mean Median Mode Of Grouped Data Cumulative Frequency Graph And Ogive Exercise 9.6
Here we have provided RS Aggarwal Solutions for Class 10 Maths Chapter 9 Exercise 9.6 for the ease of students so that they can prepare better for their exams.Q. Which of the following is not a measure of central tendency?
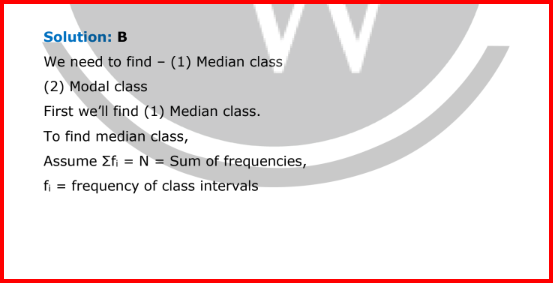
(a) Mean (b) Mode (c) Median (d) RangeSolution: C
Mean and mode does not require construction of cumulative frequency, but median necessarily requires construction of cumulative frequency, unless it is raw data (in which median is the (n/2)th value, when there are n number of observations; and the average of (n/2)th and (n/2 + 1)th values, when there are n observations).Q. Which of the following cannot be determined graphically?
(a) Mean (b) Mode (c) Median (d) None of theseSolution: C
Given: mean = 27 and median = 33 We have to find the value of mode. Empirical relationship is given by, Mode = 3(Median) – 2(Mean) ⇒ Mode = 3(33) – 2(27) ⇒ Mode = 99 – 54 = 45Q. Which of the following measures of central tendency is influenced by extreme values?
(a) Mean (b) Mode (c) Median (d) None of theseSolution: B
Solution:
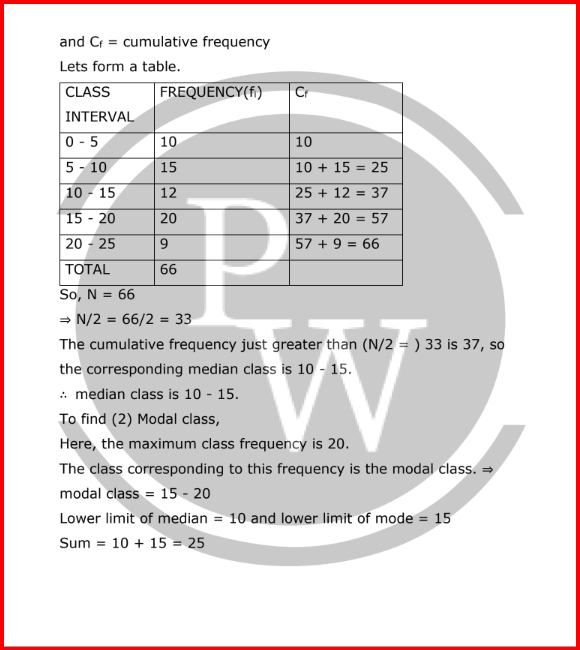
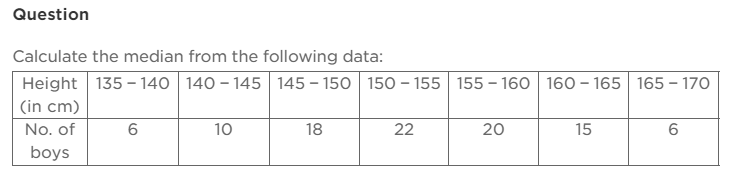
We prepare the cumulative frequency table, as shown:| Class | Frequency(f) | Cumulative frequency |
| 135-140 | 6 | 6 |
| 140-145 | 10 | 16 |
| 145-150 | 18 | 34 |
| 150-155 | 22 | 56 |
| 155-160 | 20 | 76 |
| 160-165 | 15 | 91 |
| 165-170 | 6 | 97 |
| 170-175 | 3 | 100 |
| N=Σf=100 |
Question:
The median of the following data is 16. Find the missing frequencies a and b if the total of frequencies is 70.
| Class | 0 − 5 | 5 − 10 | 10 − 15 | 15 − 20 | 20 − 25 | 25 − 30 | 30 − 35 | 35 − 40 |
| Frequency | 12 | a | 12 | 15 | b | 6 | 6 | 4 |
| Class | Frequency fi | Cumulative frequency |
| 0-5 | 12 | 12 |
| 5-10 | a | 12+a |
| 10-15 | 12 | 24+a |
| 15-20 | 15 | 39+a |
| 20-25 | b | 39+a+b |
| 25-30 | 6 | 45+a+b |
| 30-35 | 6 | 51+a+b |
| 35-40 | 4 | 55+a+b |
| Total | N=Σfi=70 |
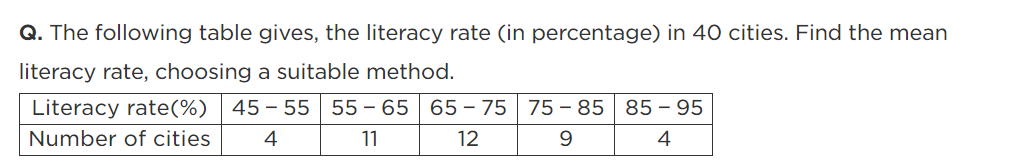
| Literacy rate (%) | Number of cities (fi) | Class mark (xi) | (fixi) |
| 45 - 55 | 4 | 50 | 200 |
| 55 - 65 | 11 | 60 | 660 |
| 65 - 75 | 12 | 70 | 840 |
| 75 - 85 | 9 | 80 | 720 |
| 85 - 95 | 4 | 90 | 360 |
| Total | ∑fi=40 | ∑(fi×xi)=2780 |
 Let us choose a = 25, h = 10,
then di = xi - 25
and
ui = (xi−25)/10
Using Step-deviation method, the given data is shown as follows:
Let us choose a = 25, h = 10,
then di = xi - 25
and
ui = (xi−25)/10
Using Step-deviation method, the given data is shown as follows:
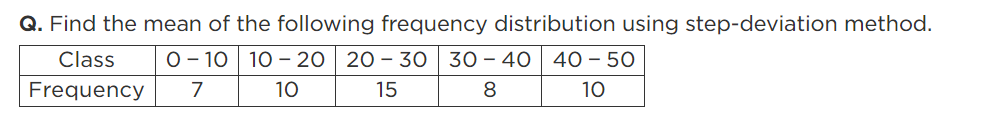
| Class | Frequency (fi) | Class mark (xi) | di= xi- 25 | ui = (xi−25)/10 | fiui |
| 0 - 10 | 7 | 5 | -20 | -2 | -14 |
| 10 - 20 | 10 | 15 | -10 | -1 | -10 |
| 20 - 30 | 15 | 25 | 0 | 0 | 0 |
| 30 - 40 | 8 | 35 | 10 | 1 | 8 |
| 40 - 50 | 10 | 45 | 20 | 2 | 20 |
| Total | ∑fi=50 | ∑(fi×ui)=4 |
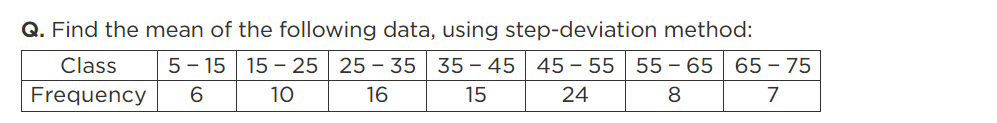
| Class | Frequency (fi) | Class mark (xi) | di= xi- 40 | ui = xi−40/10 | fiui |
| 5 - 15 | 6 | 10 | -30 | -3 | -18 |
| 15 - 25 | 10 | 20 | -20 | -2 | -20 |
| 25 - 35 | 16 | 30 | -10 | -1 | -16 |
| 35 - 45 | 15 | 40 | 0 | 0 | 0 |
| 45 - 55 | 24 | 50 | 10 | 1 | 24 |
| 55 - 65 | 8 | 60 | 20 | 2 | 16 |
| 65 - 75 | 7 | 70 | 30 | 3 | 21 |
| Total | ∑fi=86 | ∑(fi×ui)=7 |
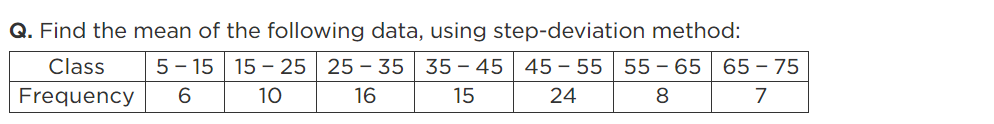
| Runs scored | 2500-3500 | 3500-4500 | 4500-5500 | 5500-6500 | 6500-7500 | 7500-8500 |
| Number of batsman | 5 | x | y | 12 | 6 | 2 |
Solution:
We prepare the cumulative frequency table, as shown:| Runs scored | No. of batsmen | Cumulative frequency |
| 2500-3500 | 5 | 5 |
| 3500-4500 | x | 5+x |
| 4500-5500 | y | 5+x+y |
| 5500-6500 | 12 | 17+x+y |
| 6500-7500 | 6 | 23+x+y |
| 7500-8500 | 2 | 25+x+y |
| Total | N=Σfi=60 |
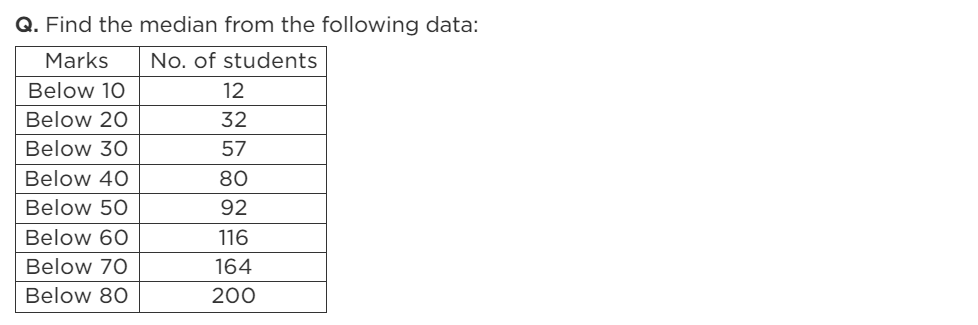
| Marks | Frequency fi | C.F |
| 0-10 | 12 | 12 |
| 10-20 | 20 | 32 |
| 20-30 | 25 | 57 |
| 30-40 | 23 | 80 |
| 40-50 | 12 | 92 |
| 50-60 | 24 | 116 |
| 60-70 | 24 | 116 |
| 70-80 | 36 | 200 |
| N=∑fi=200 |
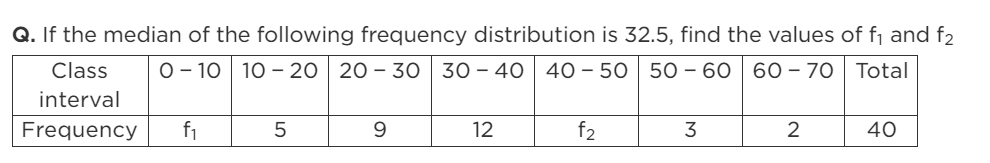
Solution:
We prepare the cumulative frequency table, as shown below:| Class | Frequency | Cumulative frequency |
| 0-10 | f1 | f1 |
| 10-20 | 5 | f1+5 |
| 20-30 | 9 | f1+14 |
| 30-40 | 12 | f1+26 |
| 40-50 | f2 | f1+f2+26 |
| 50-60 | 3 | f1+f2+29 |
| 60-70 | 2 | f1+f2+31 |
| N=Σf=40 |
Solution:
The correct answer is: (b) Both Assertion (A) and Reason (R) are true but Reason (R) is not a correct explanation of Assertion (A). Clearly, Reason (R) is true. But we got the value of mode thus: The maximum frequency is 23 and the modal class is 12-15. Using, M o d e = l + ( f 1 − f 0 2 f 1 − f 0 − f 2 ) ∗ h where l = lower limit of the modal class, h = size of the class interval (assuming all class sizes to be equal), f 1 = frequency of the modal class, f 0 = frequency of the class preceding the modal class, f 2 = frequency of the class succeeding the modal class. M o d e = 12 + ( 23 − 21 2 ∗ 23 − 21 − 10 ) ∗ 3 ⇒ M o d e = 12 + ( 2 15 ) ∗ 3 ⇒ M o d e = 12 + 0.4 ⇒ M o d e = 12.4 ∴ Assertion (A) and Reason (R) are true. However, Reason (R) isn't the correct explanation of Assertion (A). Q. The mean of 2, 7, 6 and x is 15 and the mean of 18, 1, 6, x and y is 10.What is the value of y? (a)5 (b)10 (c)20 (d)30Benefits of RS Aggarwal Solutions for Class 10 Maths Chapter 9 Exercise 9.6
- Improved Data Analysis Skills: By practicing these solutions, students can enhance their ability to analyze and visualize data using cumulative frequency curves.
- Exam Preparation: These solutions are excellent for exam preparation provide comprehensive practice that helps reinforce understanding and boosts confidence.
- Conceptual Clarity: Students develop a deeper understanding of cumulative frequency and its applications, which are important for mastering statistics.
- Expert Guidance: The solutions are prepared by subject experts from Physics Wallah, ensuring accuracy and reliable guidance for students.
- Accessible Resource: The PDF format makes it easy for students to access and use the solutions anytime, providing a convenient study aid.
RS Aggarwal Solutions for Class 10 Maths Chapter 9 Exercise 9.6 FAQs
What skills can students improve by using these solutions?
Who prepares these solutions and why is that important?
Can these solutions help with other statistical concepts?
How do RS Aggarwal Solutions help in understanding cumulative frequency distribution?