
RS Aggarwal Solutions for Class 8 Maths Chapter 22 Exercise 22.1 Constructing and Interpreting Bar Graphs

RS Aggarwal Solutions for Class 8 Maths Chapter 22 Exercise 22.1: The Physics Wallah academic team has developed a comprehensive answer for Chapter 22 of the RS Aggarwal class 8 textbook, titled Introduction to Coordinate Geometry. The RS Aggarwal class 8 solution for chapter 22 Introduction to Coordinate Geometry Exercise-22 is uploaded for reference only; do not copy the solutions.
Before going through the solution of Chapter 22 Introduction to Coordinate Geometry Exercise-22, one must have a clear understanding of the chapter 22 Introduction to Coordinate Geometry. Read the theory of chapter-22 Introduction To Coordinate Geometry and then try to solve all numerical of exercise-22. The Physics Wallah academic team created NCERT solutions to help with class 8 maths NCERT solutions, which they used to answer all of the exercise's questions.RS Aggarwal Solutions for Class 8 Maths Chapter 22 Exercise 22.1 Constructing and Interpreting Bar Graphs Overview
Chapter 22 of RS Aggarwal's Class 8 Maths, "Constructing and Interpreting Bar Graphs," focuses on visual data representation through bar graphs. This exercise, 22.1, emphasizes both the construction of bar graphs and interpreting the information they represent. Bar graphs are used to display data in a way that is easy to understand. In this chapter, students learn how to create bar graphs by plotting the given data on a graph, using rectangular bars. The height or length of these bars is proportional to the value of the data they represent. The chapter covers both single and multiple bar graphs, helping students understand how to represent different sets of data clearly. In Exercise 22.1, students are presented with problems that involve interpreting and constructing bar graphs based on given information. This allows them to practice reading data from a graph and organizing it in a logical way for graphical representation.RS Aggarwal Solutions for Class 8 Maths Chapter 22 Exercise 22.1 PDF
The exercise enhances students’ ability to use bar graphs to communicate statistical information effectively and understand patterns or trends in the given data. Hence, we have provided RS Aggarwal Solutions for Class 8 Maths Chapter 22 Exercise 22.1 Constructing and Interpreting Bar Graphs pdf -RS Aggarwal Solutions for Class 8 Maths Chapter 22 Exercise 22.1 PDF
RS Aggarwal Solutions for Class 8 Maths Chapter 22 Exercise 22.1 (Ex 21A)
Below we have provided RS Aggarwal Solutions for Class 8 Maths Chapter 22 Exercise 22.1 Constructing and Interpreting Bar Graphs -1. Write the abscissa of each of the following points:
(i) (0, 5)
(ii) (3, 7)
(iii) (-2, 4)
(iv) (6, -3)

2.Write the ordinate of each of the following points:
(i) (4, 0)
(ii) (5, 2)
(iii) (1, -4)
(iv) (-10, -7)

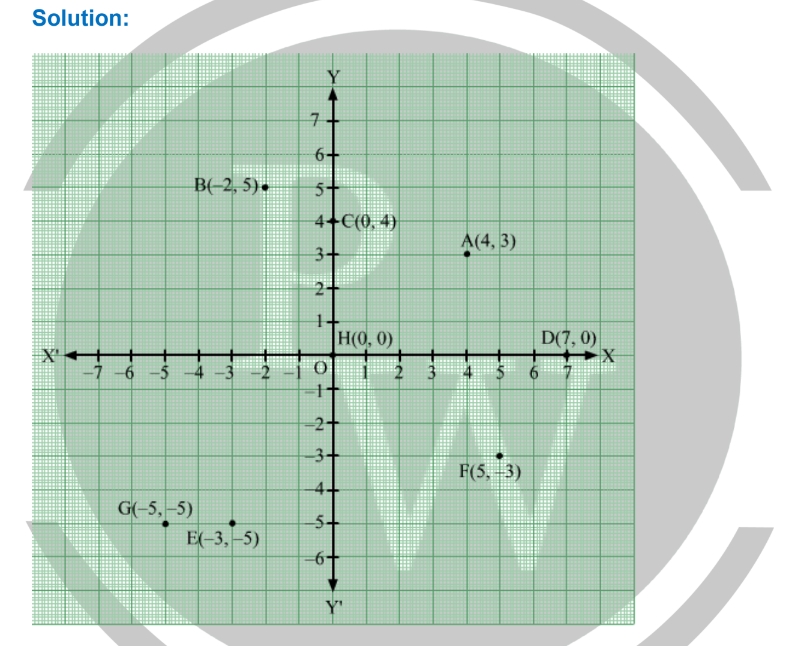
3.On a graph paper, plot each of the following points:
(i) A(4, 3)
(ii) B(-2, 5)
(iii) C(0, 4)
(iv) D(7, 0)
(v) E(-3, -5)
(vi) F(5, -3)
(vii) G(-5, -5)
(viii) H(0, 0)
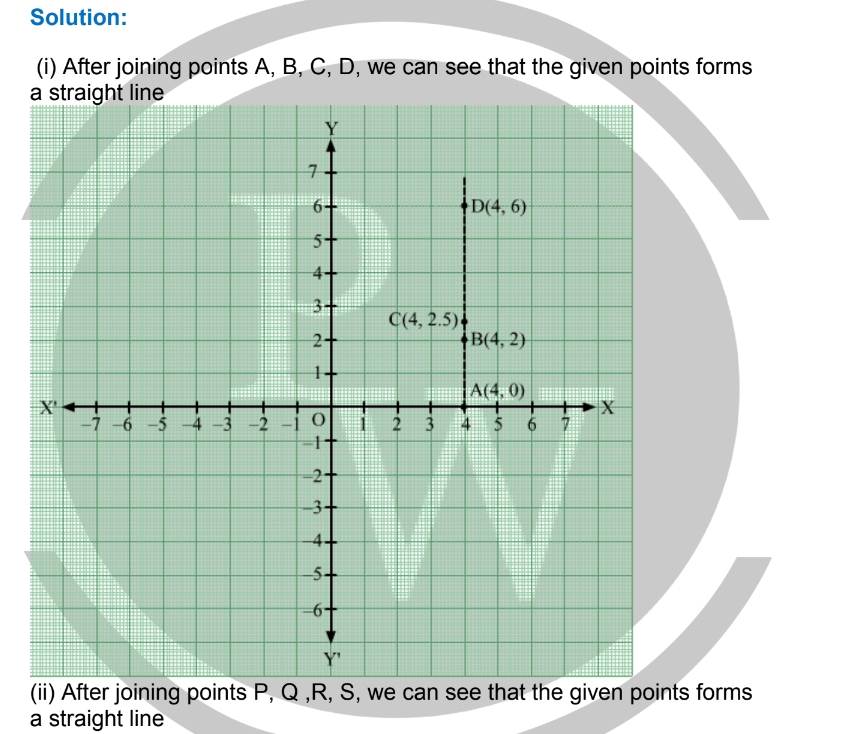
4.Plot each of the following points on a graph sheet. Verify that they lie on a line.
(i) A(4, 0), B(4, 2), C(4, 2.5) and D(4, 6)
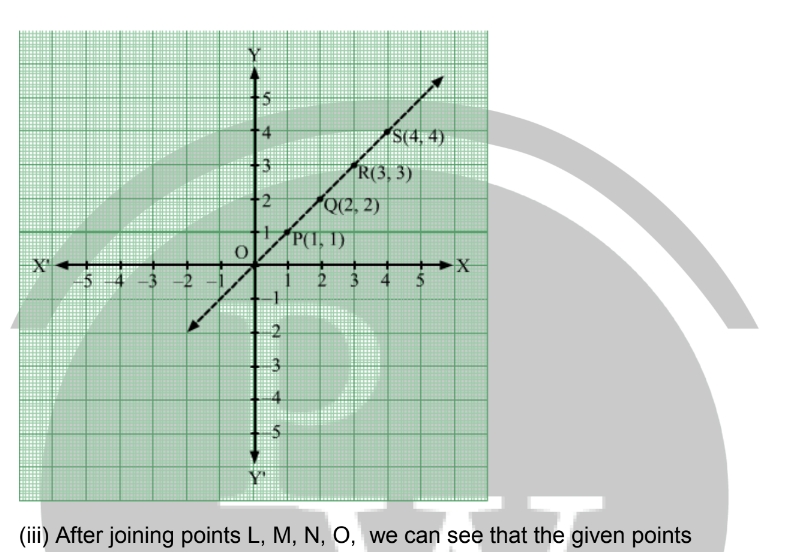
(ii) P(1, 1), Q(2, 2), R(3, 3) and S(4, 4)
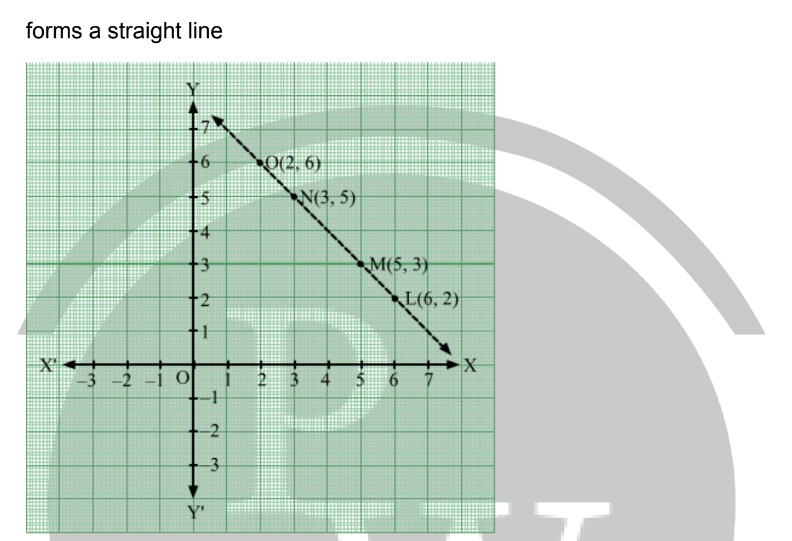
(iii) L(6, 2), M(5, 3), N(3, 5) and O(2, 6)
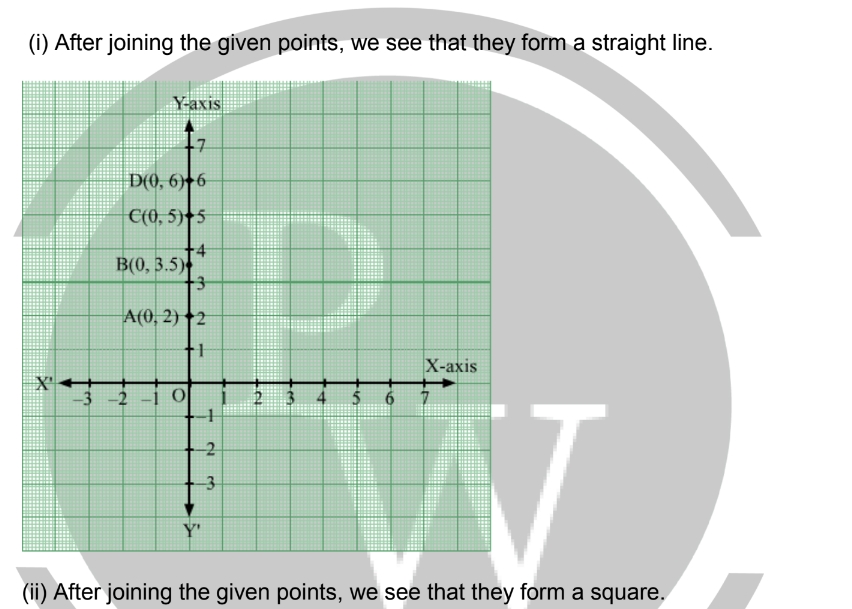
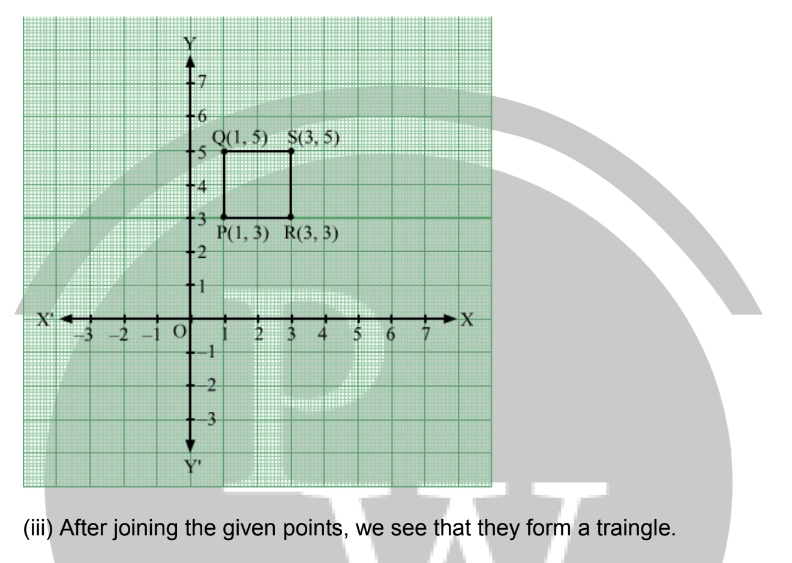
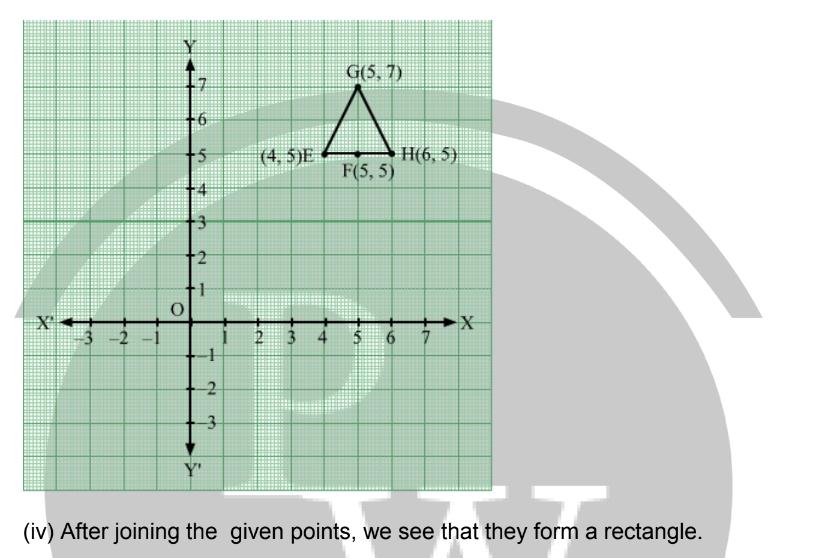
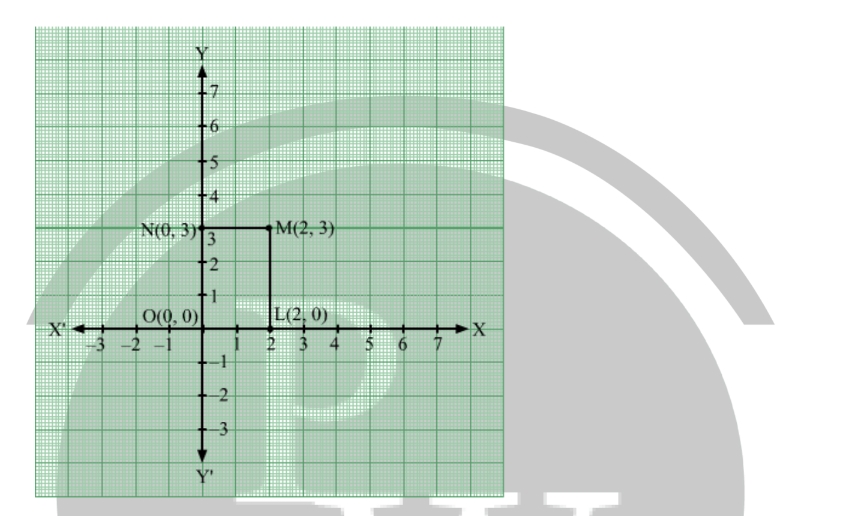
5.Plot the given points on a graph sheet and check if they lie on a straight line. If not, name the shape they form when joined in the given order.
(i) A(0, 2), B(0,3.5), C(0, 5) and D(0, 6)
(ii) P(1, 3), Q(1, 5), R(3, 3) and S(3, 5)
(iii) E(4, 5), F(5, 5), G(5, 7) and H(6, 5)
(iv) L(2, 0), M(2, 3), N(0, 3) and O(0, 0)
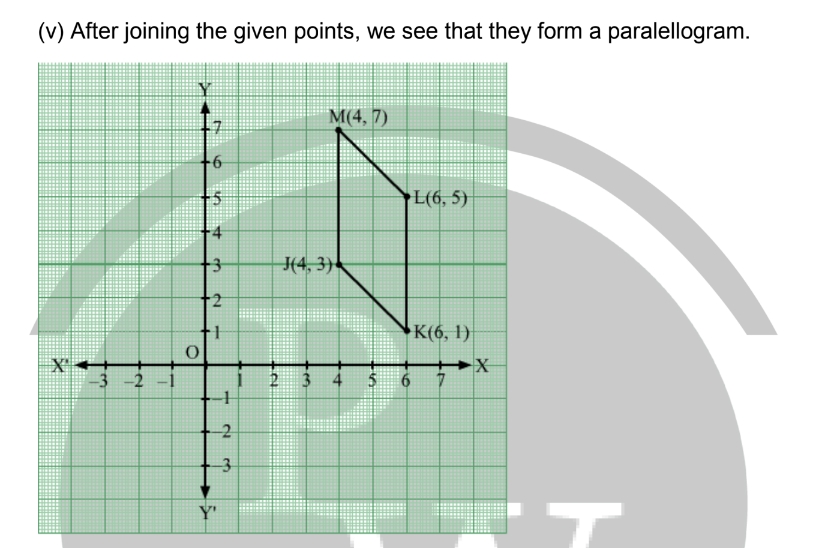
(v) J(4, 3), K(6, 1), L(6, 5) and M(4, 7)
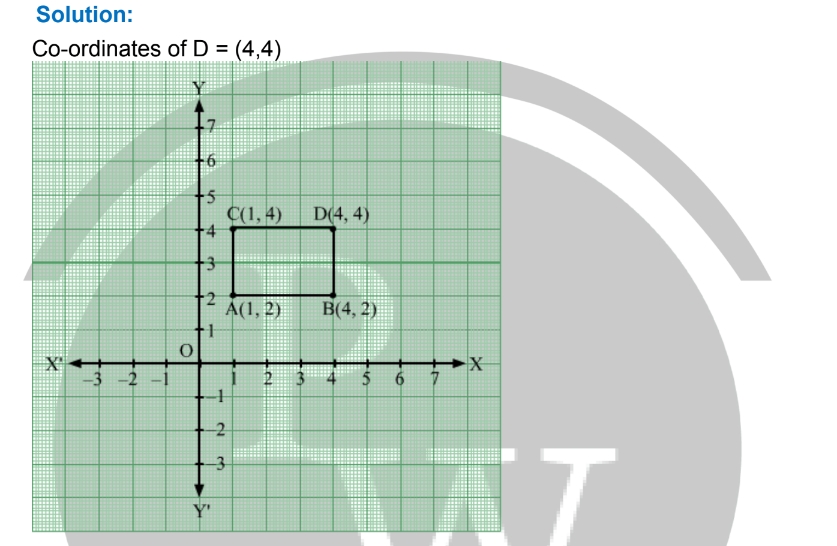
6. Locate the points A (1,2), B (4,2) and C (1,4) on a graph sheet taking suitable axes. Write the coordinates of the fourth point D to complete the rectangle ABCD.
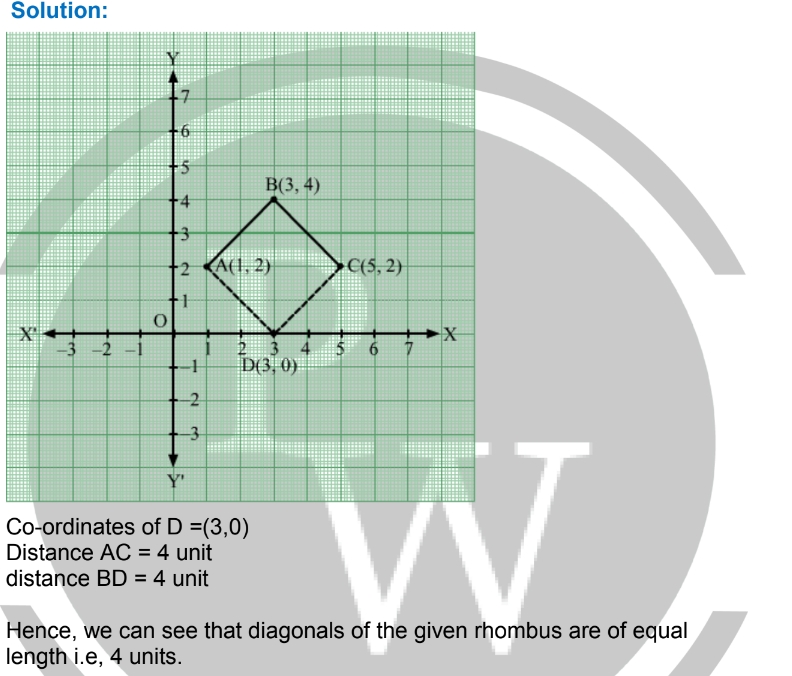
7. Locate the points A(1, 2), B(3, 4) and C(5, 2) on a graph sheet taking suitable axes. Write the coordinates of the fourth point D in order to complete the rhombus ABCD. Measure the diagonals of this rhombus and check whether they are equal or not.
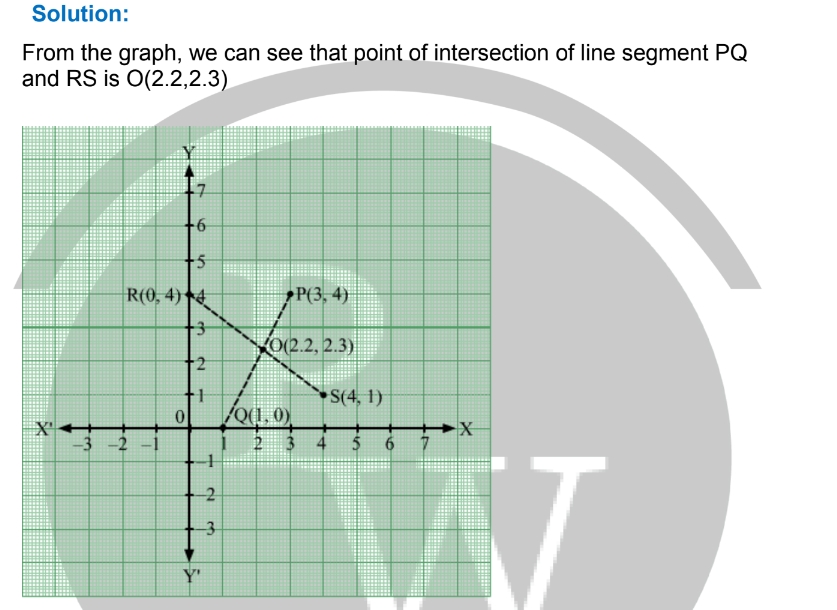
8. Locate the points P(3, 4), Q(1, 0), R(0, 4) and S(4, 1) on a graph sheet and write the coordinates of the point of intersection of line segments PQ and RS.
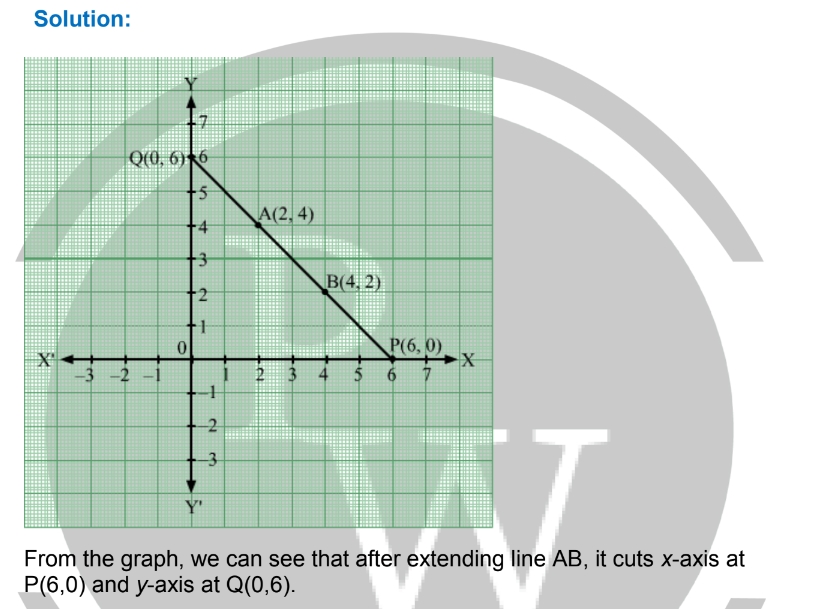
9. Plot the points A(2, 4) and B(4, 2) on a graph sheet and draw a line passing through these two points. Extend the line on both sides to meet the coordinate axes. What are the coordinates of the points where this line meets the x-axis and the y-axis?
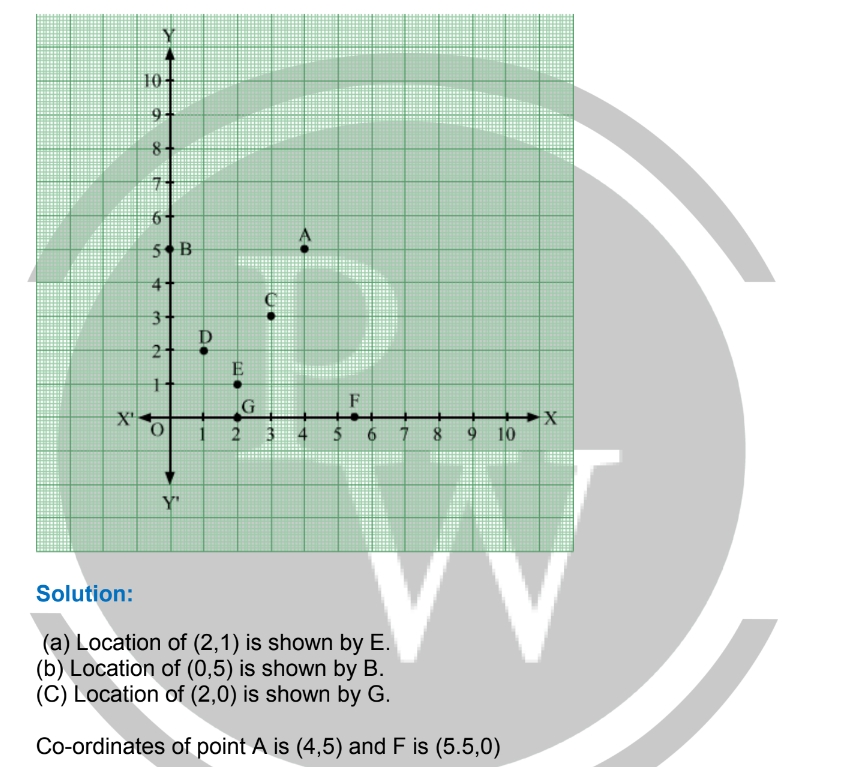
10. From the given figure, choose the letters that indicate the location of the following points:
(a) (2, 1)
(b) (0, 5)
( c) (2, 0)
Also, mention the coordinates of the points A and F.
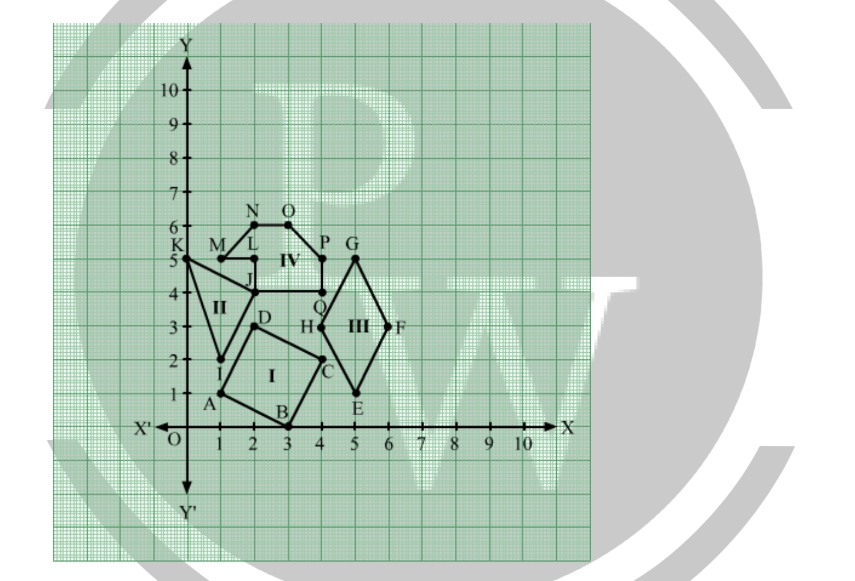
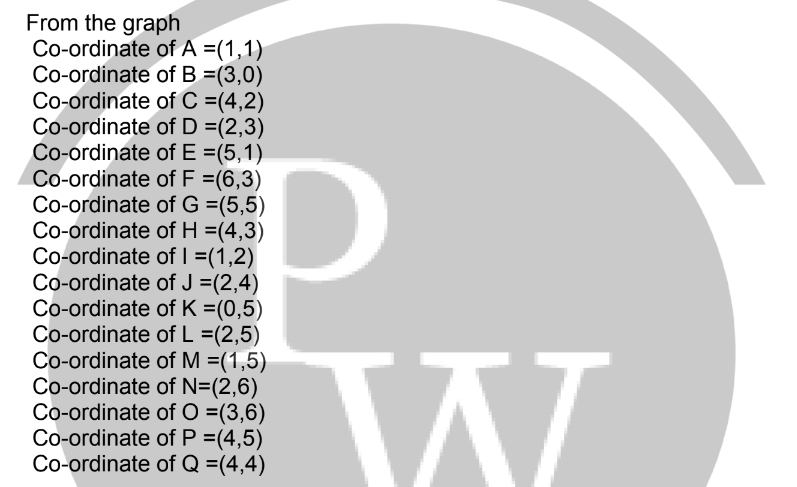
11. Write the coordinates of all the points in the graph given below:
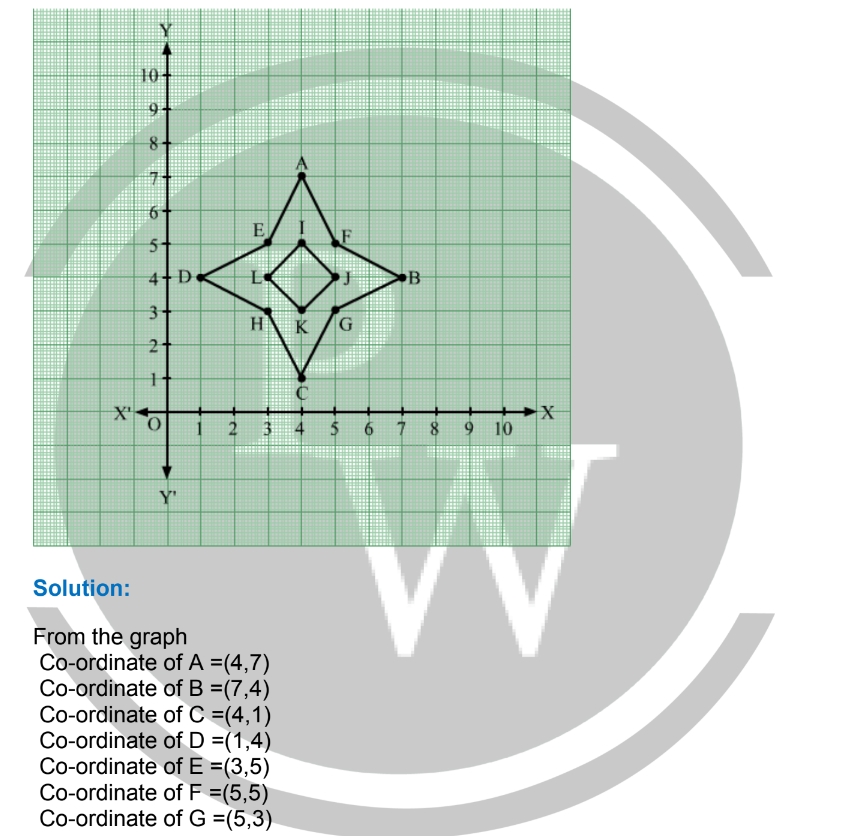

12. Write the coordinates of the vertices of each of the figures given below:
13. Fill in the blanks to make the given statements true.
(i) A point in which the x-coordinate is 0 and y-coordinate is 5 will lie on ________ .
(ii) All points with y-coordinate as 0 lie on ______ .
(iii) The x-coordinate of any point lying on the y-axis is always ______ .
(iv) The point where the two axes intersect is called the ______ .
(v) For the point (5, 2), the distance from the x-axis is _______ units.
(vi) The distance of any point from the y-axis is the _______ coordinate.
(vii) The coordinates of the origin are ______.

Benefits of RS Aggarwal Solutions for Class 8 Maths Chapter 22 Exercise 22.1
The RS Aggarwal Solutions for Class 8 Maths Chapter 22, Exercise 22.1, offers several key benefits to students, helping them master the topic of Constructing and Interpreting Bar Graphs:Clear Step-by-Step Guidance : The solutions provide detailed, step-by-step explanations on how to solve each problem. This makes it easier for students to understand the process of constructing bar graphs from given data.
Conceptual Clarity : The solutions reinforce fundamental concepts like data organization, proportional representation, and the interpretation of visual information. This helps students build a solid foundation in understanding and creating bar graphs.
Enhanced Analytical Skills : Interpreting bar graphs helps students enhance their analytical skills, as they are required to compare, contrast, and derive conclusions from the graphical data.
Improved Problem-Solving : By practicing with the solutions, students improve their ability to solve problems efficiently. They learn how to approach different types of data representation questions, which is helpful for exams.
Real-World Applications : Understanding bar graphs has practical value beyond academics, as graphical representation of data is a skill frequently used in everyday life, business, and science.
RS Aggarwal Solutions for Class 8 Maths Chapter 22 Exercise 22.1 FAQs
Why is it important to interpret bar graph?
What are simple bar graphs suitable for?
What is the main purpose of a bar graph?
What data is not suitable for a bar graph?