

T Distribution Formula, Definition, Table, Applications
T Distribution Formula : The T Distribution, often referred to as the Student’s t-distribution, is used in cases where assumptions about a mean are made without knowledge of the standard deviation. In the field of probability and statistics, the normal distribution exhibits a bell-shaped curve with a mean of μ and a standard deviation of σ. The t-distribution bears resemblance to the normal distribution, yet it is wider and shorter than its normal counterpart. This discussion will delve into the nature of the t-distribution, encompassing its formula, tabulation, properties, and practical applications
T Distribution Definition
The t-distribution, also referred to as the Student’s t-distribution, is a theoretical probability distribution utilized for making inferences about a mean in instances where the standard deviation is unknown. Exhibiting symmetry and a bell-shaped form akin to the standard normal curve, it approaches a standard normal distribution, featuring a mean of 0 and a standard deviation of 1, as the degrees of freedom (df) increase.
T Distribution Formula
The t-distribution encompasses a range of t values obtained for all potential random samples of a specific sample size or a particular degree of freedom. This distribution approximates the form of the normal distribution.
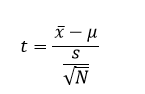
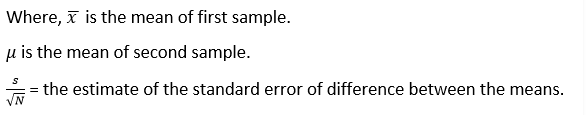
Suppose x follows a normal distribution with a mean 'μ' for a sample of size 'n,' possessing a sample mean of x̄ and a sample standard deviation 's.' The t variable conforms to the Student’s t-distribution with degrees of freedom, denoted as d.f = n – 1. The formula for the t-distribution is expressed as follows:
T Distribution Formula Table Explanation
The table for the t-distribution serves the purpose of establishing correlations associated with z-scores. It aids in identifying the ratio for t-statistics, showcasing the probability of t assuming specific values. This table illustrates the probabilities related to the t-distribution, representing the area under the t-curve between a given value and infinity.
Within the t-distribution table, critical values are outlined concerning degrees of freedom (df) paired with the probabilities of the t-distribution, denoted as α.
| df/α | 0.9 | 0.5 | 0.3 | 0.2 | 0.1 | 0.05 | 0.02 | 0.01 | 0.001 |
| 1 | 0.158 | 1 | 2 | 3.078 | 6.314 | 12.706 | 31.821 | 64 | 637 |
| 2 | 0.142 | 0.816 | 1.386 | 1.886 | 2.92 | 4.303 | 6.965 | 10 | 31.598 |
| 3 | 0.137 | 0.765 | 1.25 | 1.638 | 2.353 | 3.182 | 4.541 | 5.841 | 12.929 |
| 4 | 0.134 | 0.741 | 1.19 | 1.533 | 2.132 | 2.776 | 3.747 | 4.604 | 8.61 |
| 5 | 0.132 | 0.727 | 1.156 | 1.476 | 2.015 | 2.571 | 3.365 | 4.032 | 6.869 |
| 6 | 0.131 | 0.718 | 1.134 | 1.44 | 1.943 | 2.447 | 3.143 | 3.707 | 5.959 |
| 7 | 0.13 | 0.711 | 1.119 | 1.415 | 1.895 | 2.365 | 2.998 | 3.499 | 5.408 |
| 8 | 0.13 | 0.706 | 1.108 | 1.397 | 1.86 | 2.306 | 2.896 | 3.355 | 5.041 |
| 9 | 0.129 | 0.703 | 1.1 | 1.383 | 1.833 | 2.263 | 2.821 | 3.25 | 4.781 |
| 10 | 0.129 | 0.7 | 1.093 | 1.372 | 1.812 | 2.228 | 2.764 | 3.169 | 4.587 |
| 11 | 0.129 | 0.697 | 1.088 | 1.363 | 1.796 | 2.201 | 2.718 | 3.106 | 4.437 |
| 12 | 0.128 | 0.695 | 1.083 | 1.356 | 1.782 | 2.179 | 2.681 | 3.055 | 4.318 |
| 13 | 0.128 | 0.694 | 1.079 | 1.35 | 1.771 | 2.16 | 2.65 | 3.012 | 4.221 |
| 14 | 0.128 | 0.692 | 1.076 | 1.345 | 1.761 | 2.145 | 2.624 | 2.977 | 4.14 |
| 15 | 0.128 | 0.691 | 1.074 | 1.341 | 1.753 | 2.131 | 2.602 | 2.947 | 4.073 |
| 16 | 0.128 | 0.69 | 1.071 | 1.337 | 1.746 | 2.12 | 2.583 | 2.921 | 4.015 |
| 17 | 0.128 | 0.689 | 1.069 | 1.333 | 1.74 | 2.11 | 2.567 | 2.898 | 3.965 |
| 18 | 0.127 | 0.688 | 1.067 | 1.33 | 1.734 | 2.101 | 2.552 | 2.878 | 3.922 |
| 19 | 0.127 | 688 | 1.066 | 1.328 | 1.729 | 2.093 | 2.539 | 2.861 | 3.883 |
| 20 | 0.127 | 0.687 | 1.064 | 1.325 | 1.725 | 2.086 | 2.528 | 2.845 | 3.85 |
| 21 | 0.127 | 0.686 | 1.063 | 1.323 | 1.721 | 2.08 | 2.518 | 2.831 | 3.819 |
| 22 | 0.127 | 0.686 | 1.061 | 1.321 | 1.717 | 2.074 | 2.508 | 2.819 | 3.792 |
| 23 | 0.127 | 0.685 | 1.06 | 1.319 | 1.714 | 2.069 | 2.5 | 2.807 | 3.767 |
| 24 | 0.127 | 0.685 | 1.059 | 1.318 | 1.711 | 2.064 | 2.492 | 2.797 | 3.745 |
| 25 | 0.127 | 0.684 | 1.058 | 1.316 | 1.708 | 2.06 | 2.485 | 2.787 | 3.725 |
| 26 | 0.127 | 0.684 | 1.058 | 1.315 | 1.706 | 2.056 | 2.479 | 2.779 | 3.707 |
| 27 | 0.137 | 0.684 | 1.057 | 1.314 | 1.703 | 2.052 | 2.473 | 2.771 | 3.69 |
| 28 | 0.127 | 0.683 | 1.056 | 1.313 | 1.701 | 2.048 | 2.467 | 2.763 | 3.674 |
| 29 | 0.127 | 0.683 | 1.055 | 1.311 | 1.699 | 2.045 | 2.462 | 2.756 | 3.649 |
| 30 | 0.127 | 0.683 | 1.055 | 1.31 | 1.697 | 2.042 | 2.457 | 2.75 | 3.656 |
| 40 | 0.126 | 0.681 | 1.05 | 1.303 | 1.684 | 2.021 | 2.423 | 2.704 | 3.551 |
| 80 | 0.126 | 0.679 | 1.046 | 1.296 | 1.671 | 2 | 2.39 | 2.66 | 3.46 |
| 120 | 0.126 | 0.677 | 1.041 | 1.289 | 1.658 | 1.98 | 2.358 | 2.617 | 3.373 |
| Infinity | 0.126 | 0.674 | 1.036 | 1.282 | 1.645 | 1.96 | 2.326 | 2.576 | 3.291 |
T Distribution Formula Properties
Extends across the range from negative infinity to positive infinity.
Displays a bell-shaped curve and exhibits symmetry akin to the normal distribution.
The form of the t-distribution alters in response to changes in degrees of freedom.
The variance of the t-distribution consistently surpasses ‘1’ and is constrained to values of 3 or more degrees of freedom. This signifies that the distribution has greater dispersion than the standard normal distribution.
Applications of the T-Distribution
Hypothesis testing for the population mean.
Hypothesis testing for the variance between two means, calculated via the t-test in two distinct scenarios:
When variances are equal.
When variances are unequal.
Hypothesis testing for the variance between two means using dependent samples.
Evaluation of hypotheses regarding the Coefficient of Correlation, covering three specific cases:
When the population coefficient of correlation is zero (ρ = 0).
When the population coefficient of correlation is not zero (ρ ≠ 0).
Hypothesis examination for the difference between two independent correlation coefficients.
| Related Links | |
| Area of Trapezoid Formula | Distance Formula |
| Taylor Series Formula | Tangent Line Formula |
T Distribution Formula FAQs
What is the T Distribution used for?
What does the T Distribution formula represent?
How does the T Distribution differ from the normal distribution?
What influences the shape of the T Distribution?
When is the T Distribution table used?