
Bar Graph DI, Data Interpretations Questions and Formula
A Bar Graph is a graph that shows all data as rectangular bars whose height is proportional to their values. Get the details of Bar Graph Formula & Questions asked in the Bank Exams.
Bar Graph DI
A bar graph (or bar chart) is a visual representation of data where individual values are depicted by the length or height of bars. It is commonly used to compare different categories of data. Each bar represents a category of data and the length or height of the bar is proportional to the value it represents.Key Features of Bar Graph DI
Axes : A bar graph typically has two axes:- The x-axis (horizontal) represents the categories being compared.
- The y-axis (vertical) represents the value or frequency of the categories.
Types of Bar Graphs
- Vertical Bar Graph : Bars are oriented vertically. The height of the bar indicates the value.
- Horizontal Bar Graph : Bars are oriented horizontally. The length of the bar indicates the value.
- Grouped Bar Graph : Used to represent data from different groups side-by-side for each category.
- Stacked Bar Graph : Each bar is divided into sub-parts representing different groups, with the whole bar representing the total.
Bar Graph DI Formula
Creating a bar graph involves organizing data and plotting it appropriately, but there isn't a single "formula" for a bar graph in the way there might be for a mathematical equation. However, the steps and considerations involved in constructing a bar graph can be broken down as follows:Steps to Create a Bar Graph:
- Identify the Variables :
- Independent Variable (X-axis) : The categories or groups you are comparing.
- Dependent Variable (Y-axis) : The values or frequencies corresponding to each category.
- Organize the Data :
- Collect the data that you want to display.
- Ensure the data is grouped appropriately.
- Determine the Scale :
- Choose a scale for the Y-axis that accommodates the range of your data.
- Make sure the scale is evenly spaced and easy to read.
- Draw the Axes :
- Draw the X-axis and Y-axis on your graph paper or plotting software.
- Label the axes with the appropriate variable names and units of measure.
- Plot the Bars :
- For each category on the X-axis, draw a bar whose height or length corresponds to its value on the Y-axis.
- Ensure bars are of equal width and are spaced evenly.
- Label the Graph :
- Add a title to the graph.
- Label each bar with the category it represents.
- Optionally, add the actual value at the top of each bar for clarity.
How to Solve Bar Graph Questions?
Solving bar graph questions typically involves interpreting the data presented in the graph and using it to answer specific questions. Here’s a step-by-step approach to effectively solve bar graph questions: Steps to Solve Bar Graph Questions:- Read the Title and Labels:
-
-
- Start by reading the title of the bar graph to understand what data it represents.
- Check the labels on the x-axis (categories) and y-axis (values or frequencies).
-
- Examine the Bars:
-
-
- Look at the lengths or heights of the bars. Each bar represents a category or group, and the length or height corresponds to the value or frequency of that category.
-
- Understand the Scale:
-
-
- Check the scale of the graph to understand the intervals and range of values represented on the y-axis.
-
- Analyze the Data:
-
-
- Compare the lengths or heights of bars across different categories to identify trends or variations.
- Look for any outliers or significant differences between categories.
-
Interpret Specific Questions
:
- Read each question carefully to understand what specific information is being asked.
- Identify which parts of the bar graph are relevant to answering the question.
-
- Use Mathematical Operations (if necessary):
-
-
- If the question requires calculations (such as finding averages, percentages, etc.), perform the necessary mathematical operations using the data from the bar graph.
-
- Verify and Double-check:
-
- After solving the question, double-check your answer to ensure it aligns with the information provided by the bar graph.
- Pay attention to units of measurement or any specific details mentioned in the question.
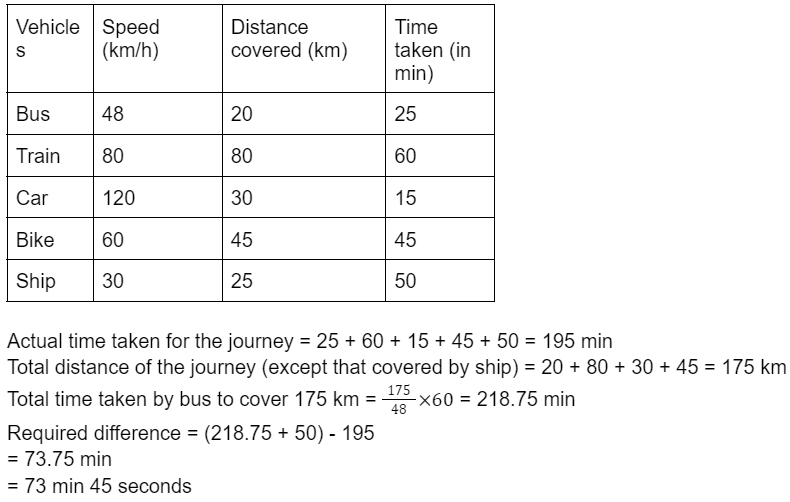
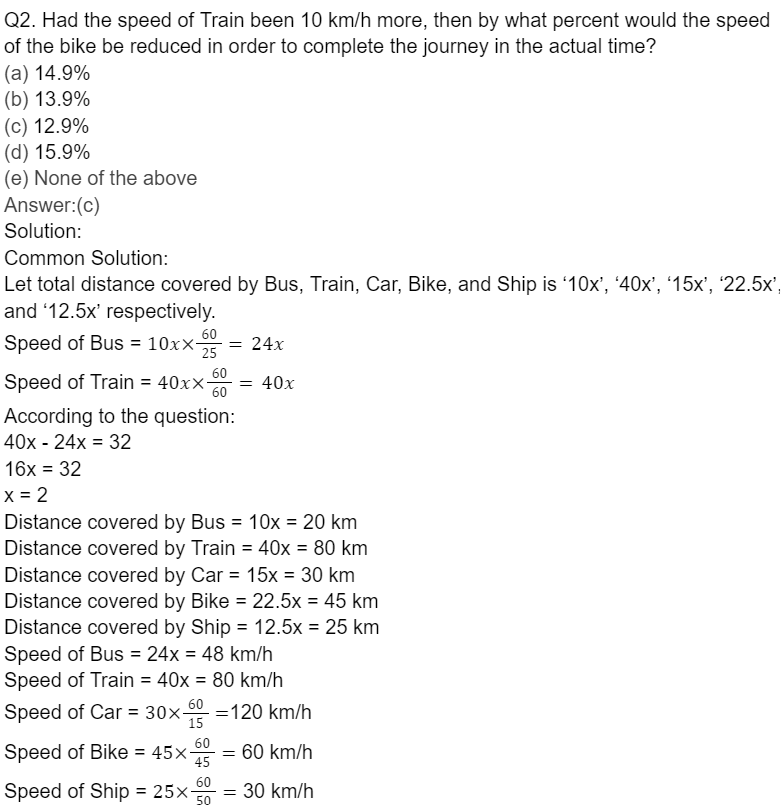
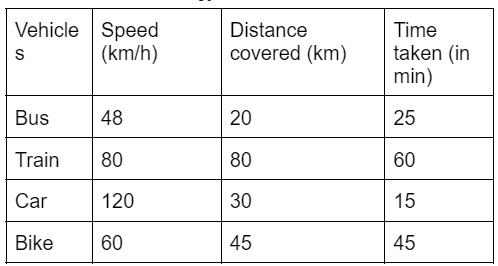
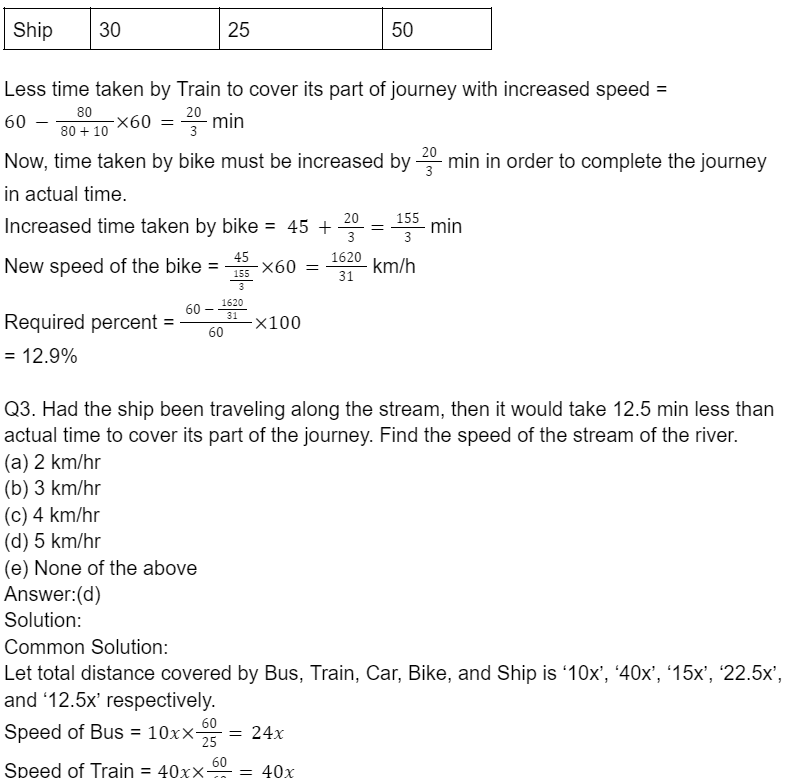
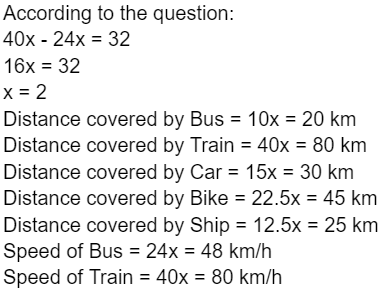
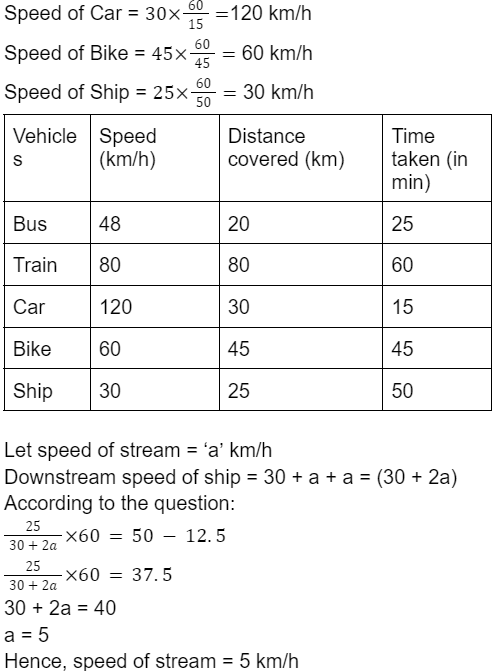
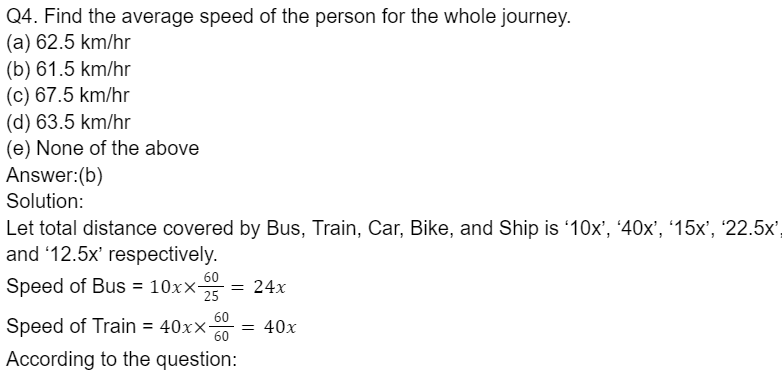
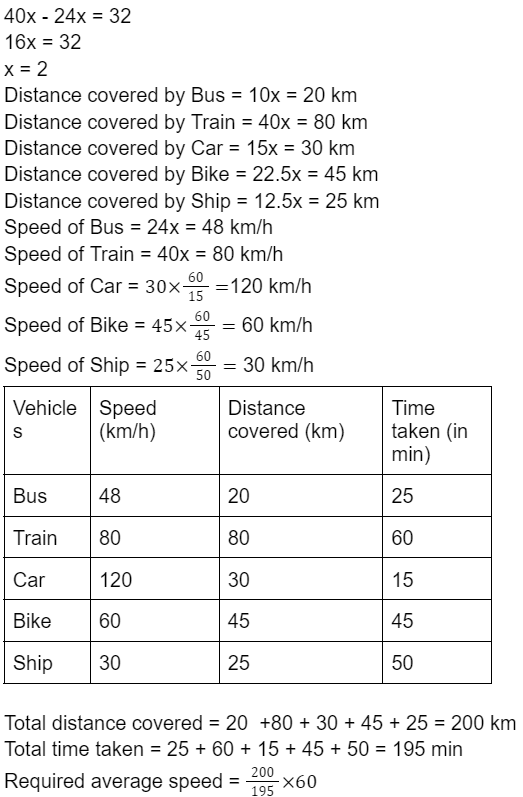
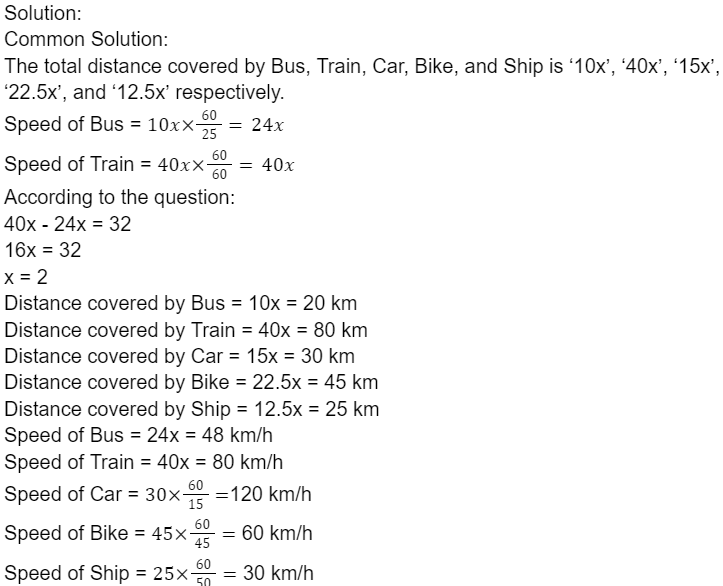
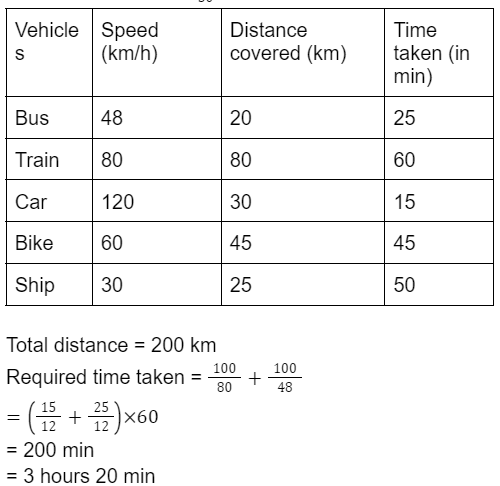
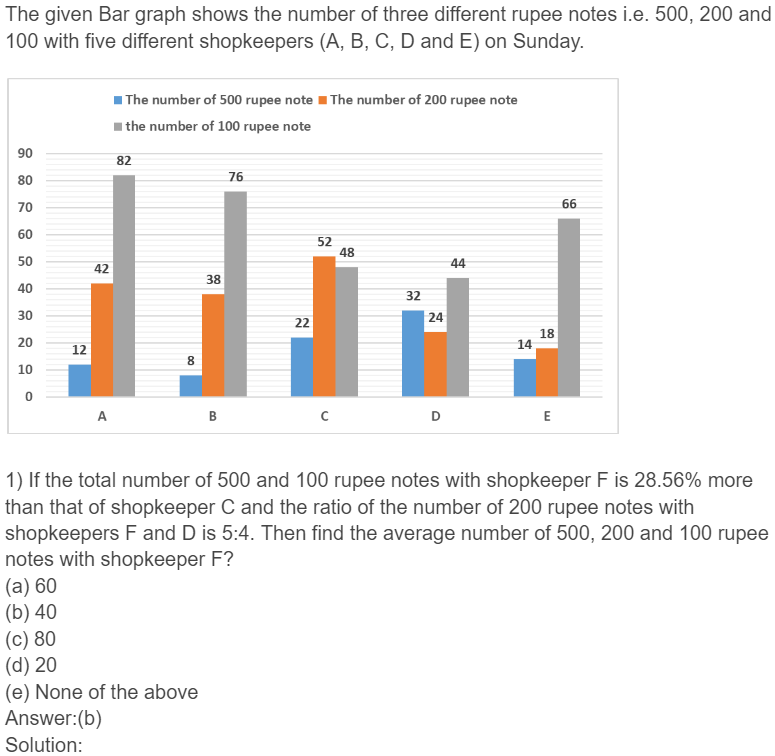
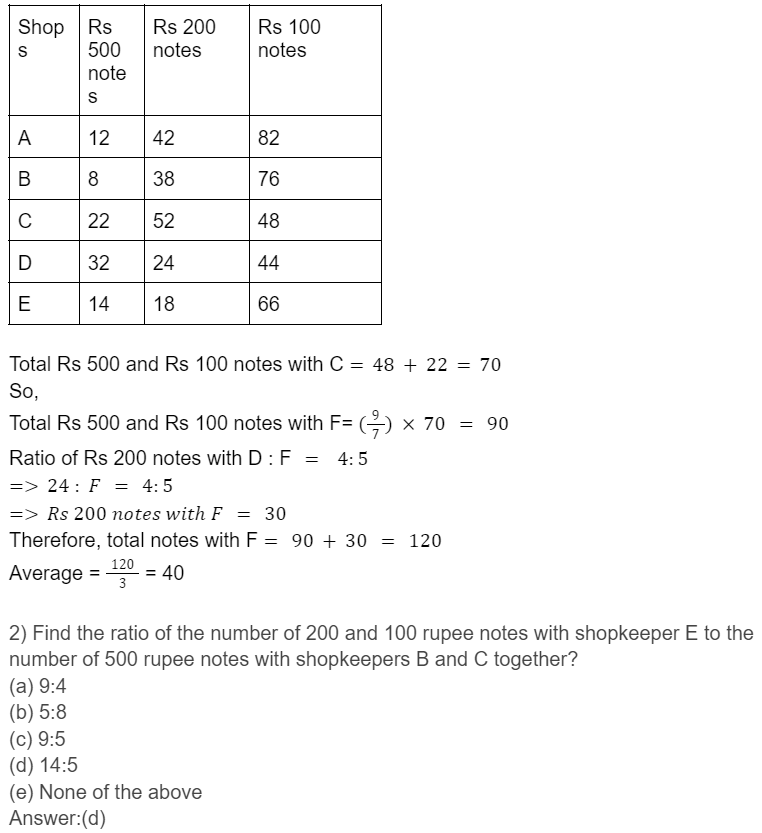
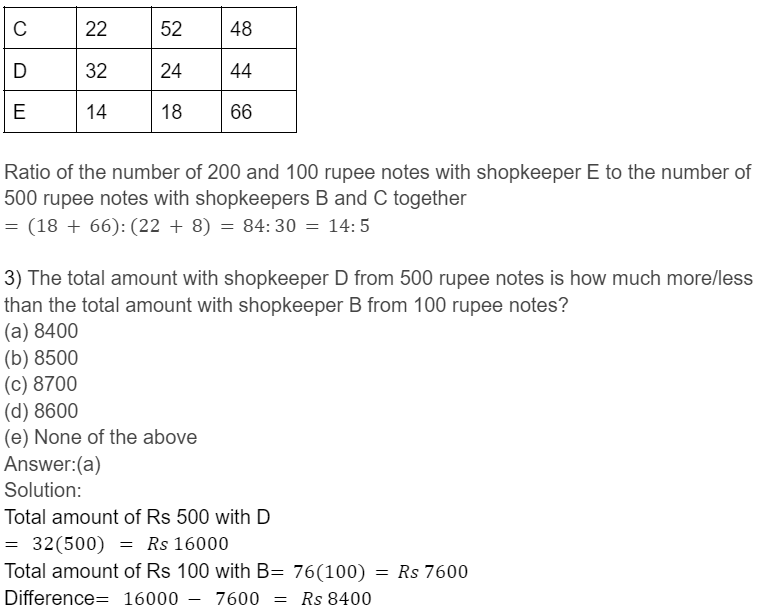
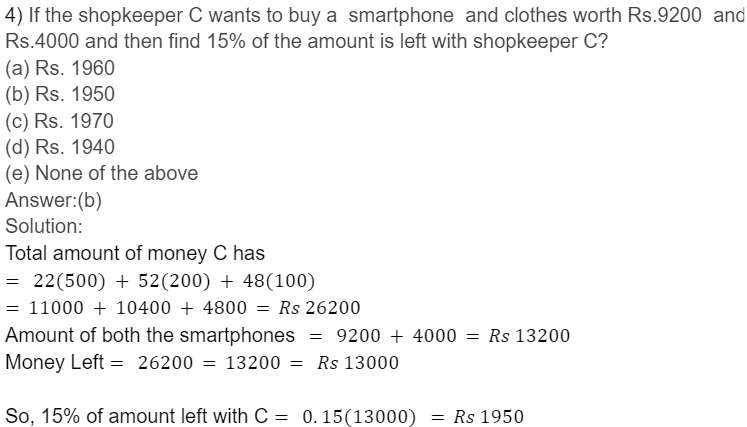
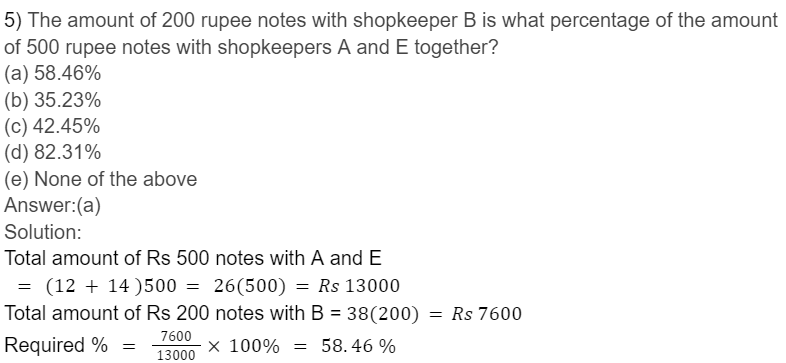
Bar Graph Solved Problems

Weightage of Bar Graph DI Questions
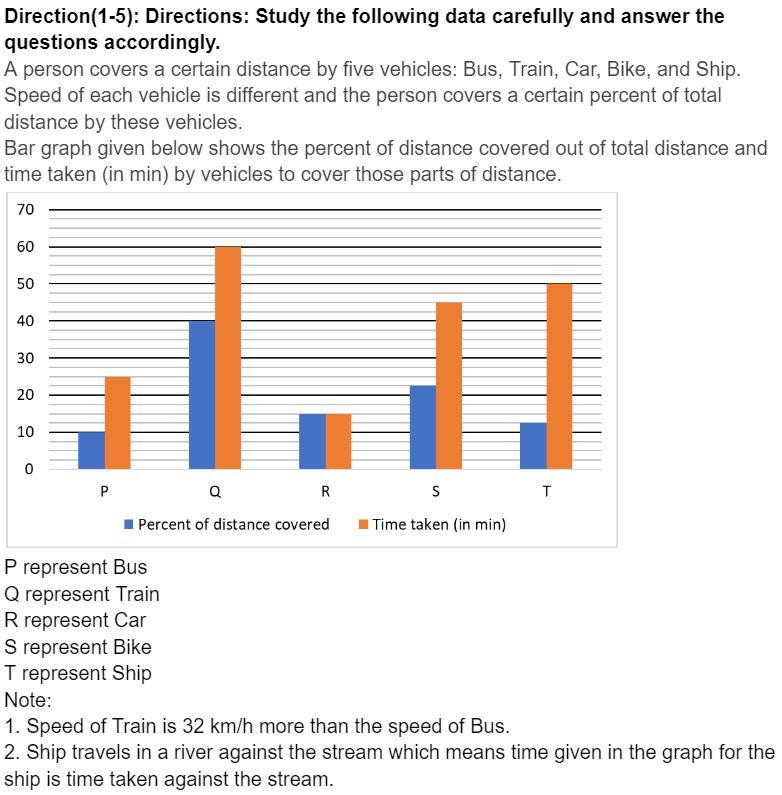
In banking exams, such as the IBPS (Institute of Banking Personnel Selection), SBI PO (State Bank of India Probationary Officer), and other similar exams, bar charts are a significant component of the Data Interpretation (DI) section. The weightage of bar charts can vary depending on the specific exam and the year.Previous Year Questions Of Bar Graph DI
| Related Links | |
|---|---|
| Quadratic Equations | Number System |
| Vedic Maths | Pie Chart DI |
| Time and Work | Problem on Ages |
| Flow Chart DI | |
| Arithmetic DI | Permutation and Combination |
Bar Graph DI FAQs
Q1. What is a Bar Graph?
Ans. A Bar Graph, also known as a bar chart, is a graphical representation of data where the length or height of bars corresponds to the value they represent. It is commonly used to compare categorical data across different groups or categories.
Q2. What are the components of a bar graph?
Ans. The main components of a bar graph include: X-axis: Represents the categories or groups being compared. Y-axis: Represents the values or frequencies of the categories. Bars: Vertical or horizontal rectangles whose lengths or heights represent the values of the categories. Title: Describes the content or purpose of the graph. Axes labels: Provide information about the data displayed on each axis.
Q3. What are the types of bar graphs?
Ans. There are several types of bar graphs: Vertical bar graph: Bars are drawn vertically. Horizontal bar graph: Bars are drawn horizontally. Grouped bar graph: Compares values of different groups within each category. Stacked bar graph: Shows the total and the breakdown of each category into sub-categories.
Q4. When should I use a bar graph?
Ans. Bar graphs are useful when you want to: Compare data across different categories. Show changes over time for discrete categories. Display rankings or distributions clearly.
Q5. How do you interpret a bar graph?
Ans. To interpret a bar graph: Examine the length or height of each bar to understand the value it represents. Compare bars to identify trends, patterns, or variations across categories. Check the scale and labels on the axes to ensure accurate interpretation of values.
Q6. What are some tips for creating an effective bar graph?
Ans. Choose an appropriate type of bar graph based on the data and the message you want to convey. Ensure the axes are clearly labeled with appropriate units. Use consistent colors and spacing between bars. Avoid clutter and unnecessary elements that can distract from the main message. Provide a clear title that summarizes the information presented in the graph.
Q7. How do you solve questions based on bar graphs?
Ans. To solve questions based on bar graphs: Read the graph title and axis labels to understand the data presented. Analyze the bars to identify highest or lowest values, trends, or comparisons. Perform calculations if required (e.g., finding averages, percentages). Verify your answers by cross-checking with the data provided in the graph.
Q8. What are some common mistakes to avoid when interpreting bar graphs?
Ans. Common mistakes to avoid include: Misinterpreting the scale or units on the axes. Incorrectly comparing bars without considering the scale or baseline. Overlooking the title or axis labels that provide crucial information about the data.
Q9. How can bar graphs be used in real-life scenarios?
Ans. Bar graphs are used in various real-life scenarios such as: Business: Analyzing sales figures across different products or regions. Education: Comparing student performance in different subjects. Healthcare: Tracking patient outcomes across different treatment methods. Market Research: Understanding consumer preferences or market trends.
10. Where can I find practice questions to improve my skills with bar graphs?
Ans. You can find practice questions on bar graphs in: Banking exam preparation books and websites. Educational websites that offer sample questions and quizzes. Online courses or tutorials focusing on data interpretation and visualization.

🔥 Trending Blogs
Talk to a counsellorHave doubts? Our support team will be happy to assist you!

Check out these Related Articles


Join 15 Million students on the app today!

Free Learning Resources
PW Books
Notes (Class 10-12)
PW Study Materials
Notes (Class 6-9)
Ncert Solutions
Govt Exams
Our Other Websites
Class 6th to 12th Online Courses
Govt Job Exams Courses
UPSC Coaching
Defence Exam Coaching
Gate Exam Coaching
Other Exams
Know about Physics Wallah
Physics Wallah is an Indian edtech platform that provides accessible & comprehensive learning experiences to students from Class 6th to postgraduate level. We also provide extensive NCERT solutions, sample paper, NEET, JEE Mains, BITSAT previous year papers & more such resources to students. Physics Wallah also caters to over 3.5 million registered students and over 78 lakh+ Youtube subscribers with 4.8 rating on its app.
We Stand Out because
We provide students with intensive courses with India’s qualified & experienced faculties & mentors. PW strives to make the learning experience comprehensive and accessible for students of all sections of society. We believe in empowering every single student who couldn't dream of a good career in engineering and medical field earlier.
Our Key Focus Areas
Physics Wallah's main focus is to make the learning experience as economical as possible for all students. With our affordable courses like Lakshya, Udaan and Arjuna and many others, we have been able to provide a platform for lakhs of aspirants. From providing Chemistry, Maths, Physics formula to giving e-books of eminent authors like RD Sharma, RS Aggarwal and Lakhmir Singh, PW focuses on every single student's need for preparation.
What Makes Us Different
Physics Wallah strives to develop a comprehensive pedagogical structure for students, where they get a state-of-the-art learning experience with study material and resources. Apart from catering students preparing for JEE Mains and NEET, PW also provides study material for each state board like Uttar Pradesh, Bihar, and others
Copyright © 2026 Physicswallah Limited All rights reserved.