
Pie Chart DI, Data Interpretations Questions, Formulas and Examples
Pie Chart DI is discussed here. A graph type used to display data is called a pie chart. In most cases, it is superior to a bar chart or a line chart for determining the structure of many parts of a single entity.
Key Features of Pie Chart DI
A Pie Chart DI is a type of graph that displays data in a circular format, divided into slices to illustrate numerical proportions. Each slice represents a category and its size is proportional to the quantity it represents, making it easy to compare parts of a whole. Here are some key features Questions can be answered more quickly by using time-saving DI techniques such rapid percentage computations, approximation, and ratio procedures.Pie Chart Data Interpretation and uses of pie charts- Circular Shape : The entire chart is a circle, symbolizing a complete set of data.
- Slices : Each slice corresponds to a specific category or data point. The size of each slice is proportional to its percentage of the total.
- Labels : Often, labels or legends are used to describe what each slice represents. Sometimes, the actual percentage value is also displayed on or near the slices.
- Colors : Different colors are typically used to differentiate the slices for better visual distinction.
Pie Chart DI Formula
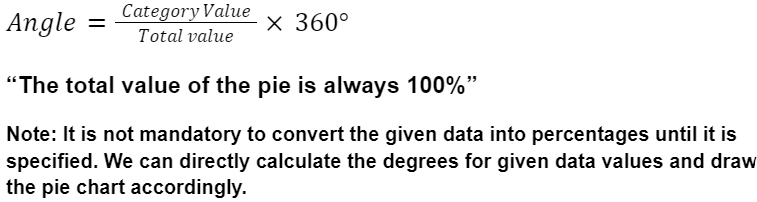
Focusing on relative values rather than computing each data point in detail makes pie chart and bar graph comparison problems easier to solve and enables you to answer with quickness and confidence. To create a pie chart, you need to calculate the size of each slice (or segment) in terms of angles in degrees. Here is the step-by-step process and the Pie chart formulas to determine the angle for each category in the Pie Chart DI:Steps:
- Collect Data : Gather the data that you want to represent in the pie chart.
- Sum of Data : Calculate the total sum of all the data values.
- Calculate Proportions : Determine the proportion of each category relative to the total sum.
- Convert to Angles : Convert these proportions into angles that can be represented in the pie chart.
How to Solve Pie Chart Data Interpretation?
Solving Pie chart interpretation questions involves interpreting the chart to extract meaningful information, such as proportions, percentages, and comparisons among different categories. Here’s a step-by-step guide to help you solve pie chart Data Interpretation effectively: Step-by-Step Guide:- Understand the Chart:
- Title: Check the title of the pie chart to understand what data it represents.
- Labels and Legend: Look at the labels and the legend to identify the categories and their corresponding slices.
- Values: Note if the values (percentages, numbers) are provided directly on the chart.
- Total Value:
- If the total value is not provided, add up all the category values (if given) to determine the total.
- Calculate Proportions:
- For each category, you may need to determine its proportion of the total. Use the formula:
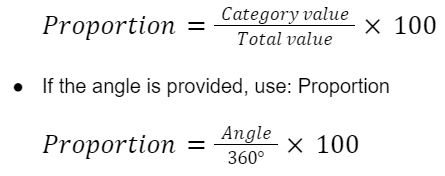
- Solve Specific Questions:
- Finding the Value of a Category : If the percentage is given, find the value by:

- Comparing Categories : Compare the sizes of slices to determine which categories are larger or smaller.
- Finding Missing Values: Use the given percentages or values to find missing information. Ensure the total adds up to 100% or the total value.
Best Pie Chart DI Examples
In this section, Practice pie chart problems are given here
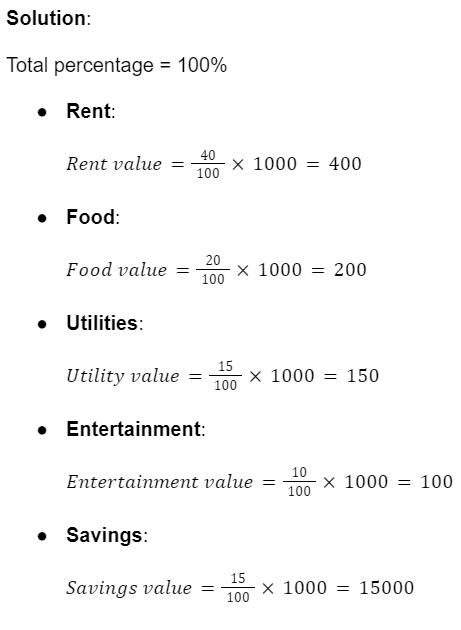
Q1 : A pie chart shows the distribution of a budget of $1000 into Rent, Food, Utilities, Entertainment, and Savings. The chart indicates Rent is 40%, Food is 20%, Utilities are 15%, Entertainment is 10%, and Savings are 15%. Calculate the dollar amount for each category.
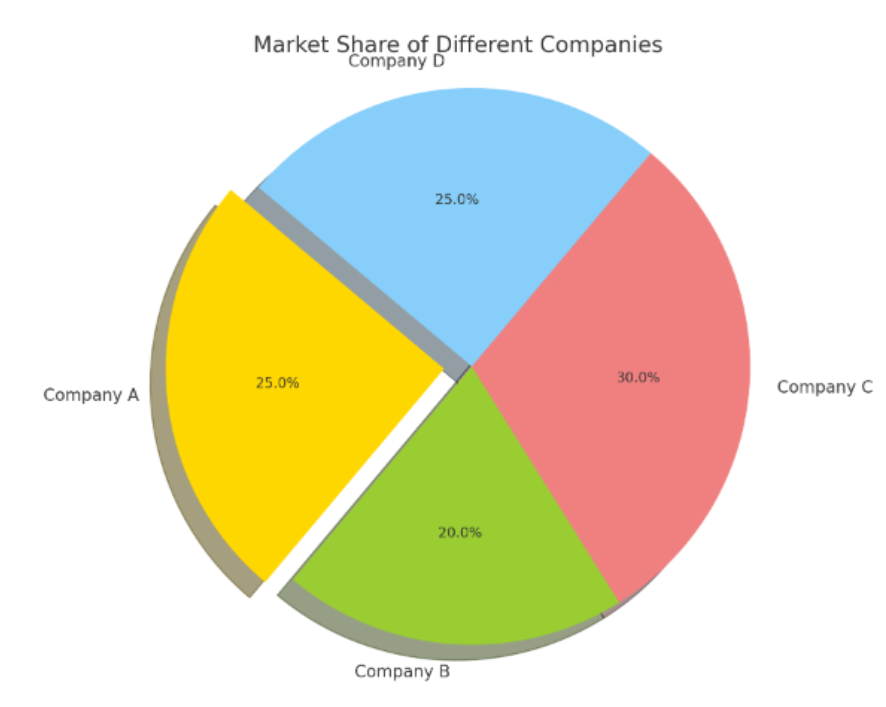
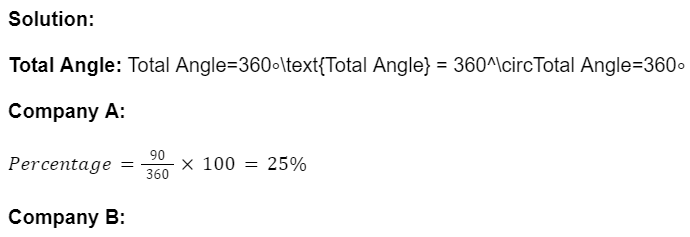
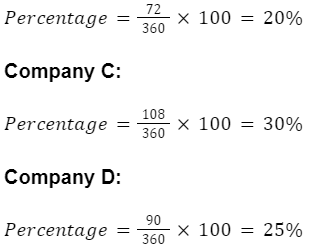
Q 2: A pie chart shows the market share of different companies. Company A has an angle of 90°, Company B has 72°, Company C has 108°, and Company D has 90°. Calculate the percentage market share for each company.
Tips for Solving Pie Chart Questions
- Double-Check Totals : Ensure that the total percentage adds up to 100% or the total value matches the given sum.
- Use Proportions : When actual values are not given, use proportions and percentages to find the needed information.
- Visual Inspection : Sometimes a quick visual comparison can help answer questions about which category is largest or smallest.
Weightage of Pie Chart DI
In banking exams, such as the IBPS (Institute of Banking Personnel Selection), SBI PO (State Bank of India Probationary Officer), and other similar exams, pie charts are a significant component of the Data Interpretation (DI) section. The weightage of pie charts can vary depending on the specific exam and the year.Advantages of Pie Charts
- Simplicity: Easy to understand and interpret at a glance.
- Visual Appeal: Visually appealing way to represent data, making it accessible to a wide audience.
- Effective for Small Data Sets: Best suited for data sets with a limited number of categories.
Limitations of Pie Charts
- Not Suitable for Large Data Sets: Can become cluttered and hard to read with too many categories.
- Difficult to Compare Slices: Hard to compare slices that are similar in size.
- Not Ideal for Showing Trends: Pie charts are static and do not effectively show changes over time.
Pie Chart DI Solved Problems
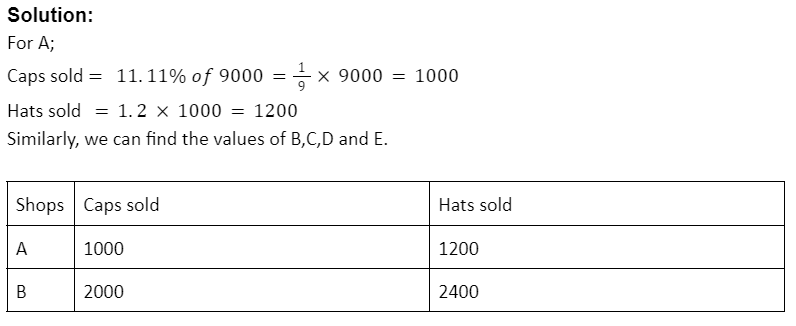
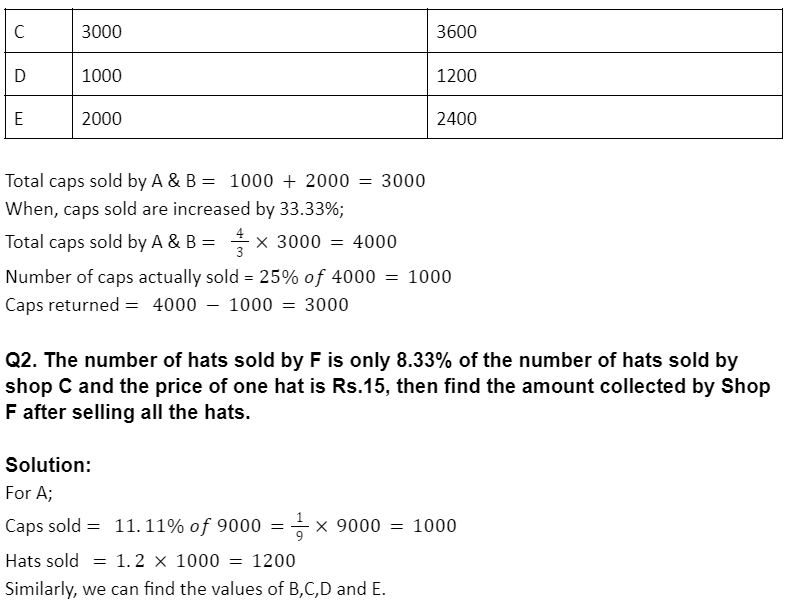
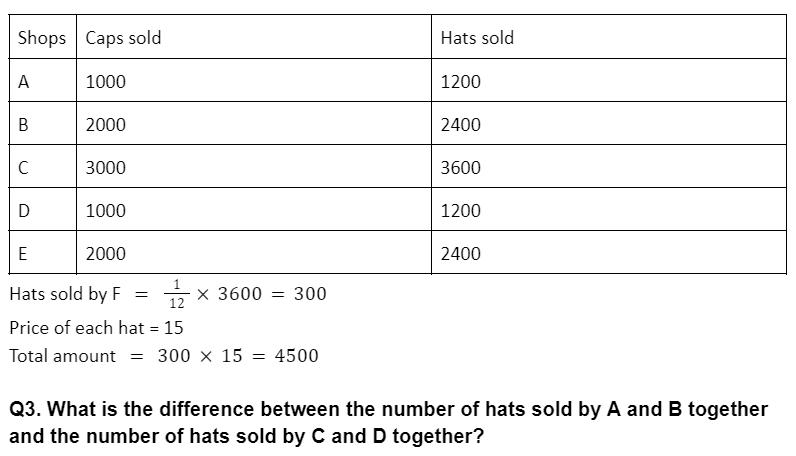
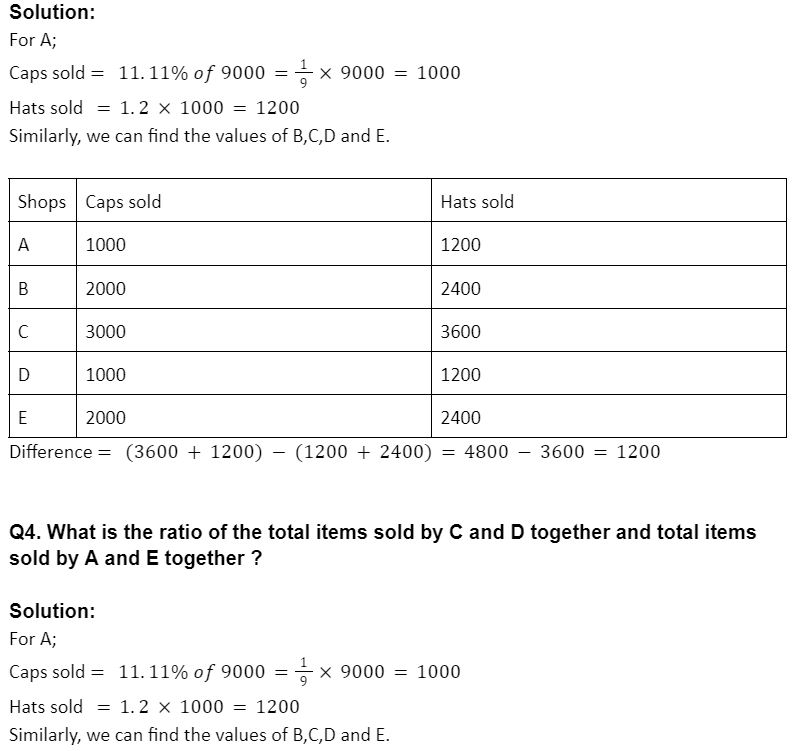
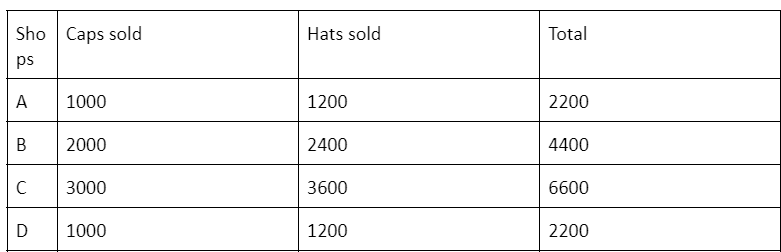
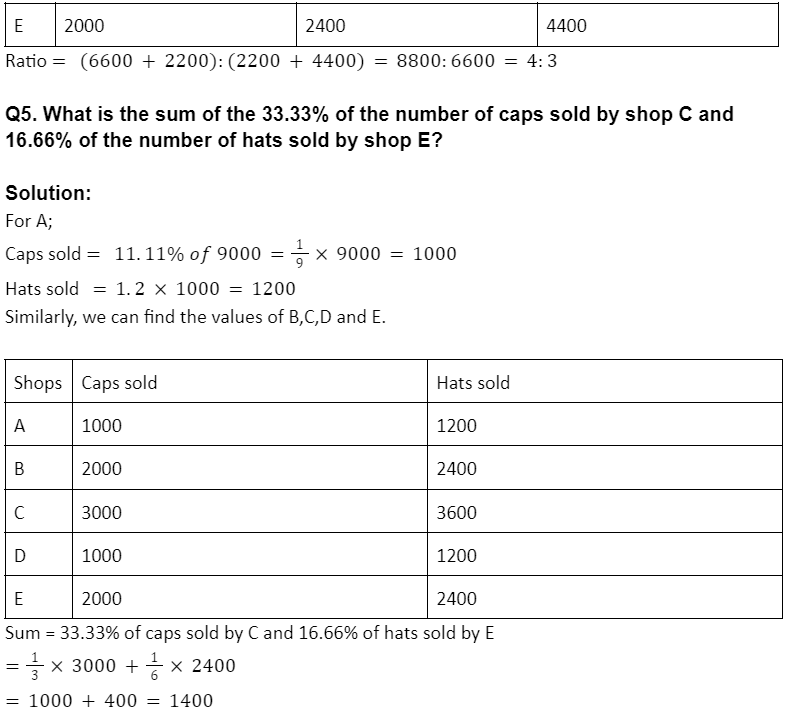
Previous Year Questions Of Pie Chart Asked In Banking Exams
Pie chart questions for banking exams that was asked in exams. Building proficiency in data interpretation shortcuts is crucial for competitive exams where accuracy and speed are crucial.
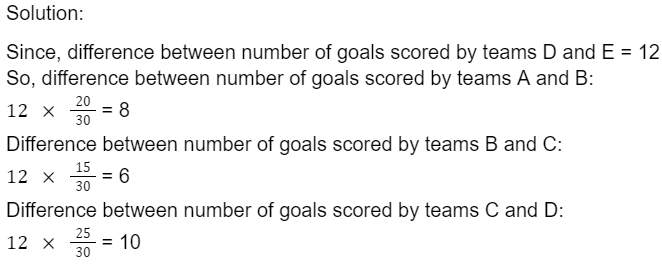
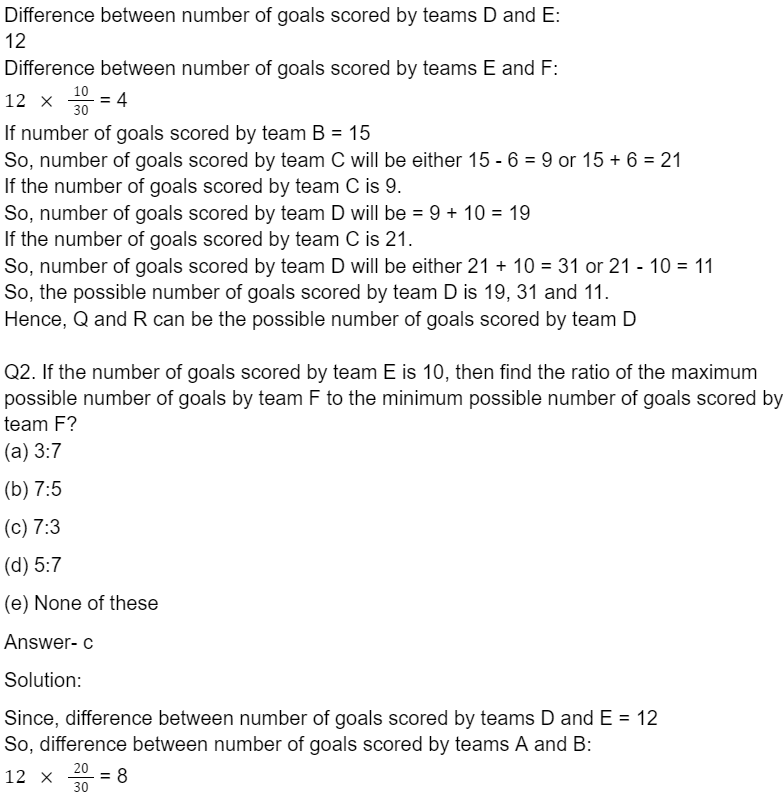
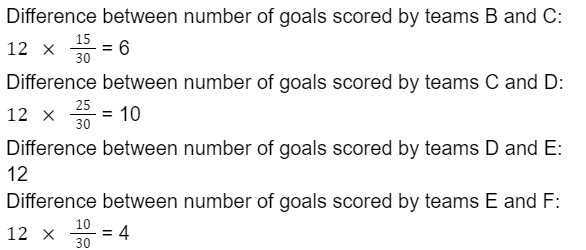
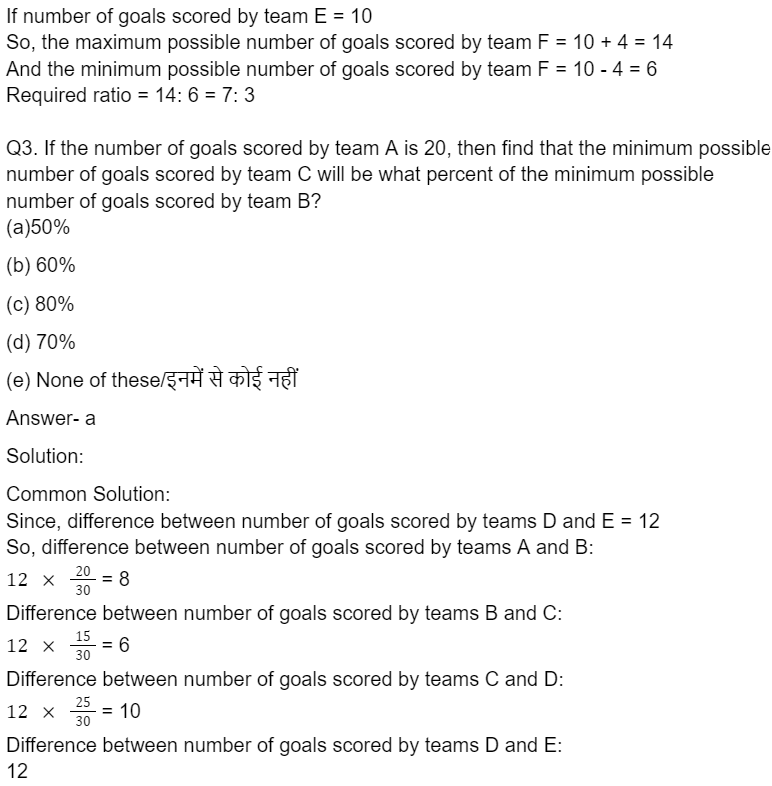
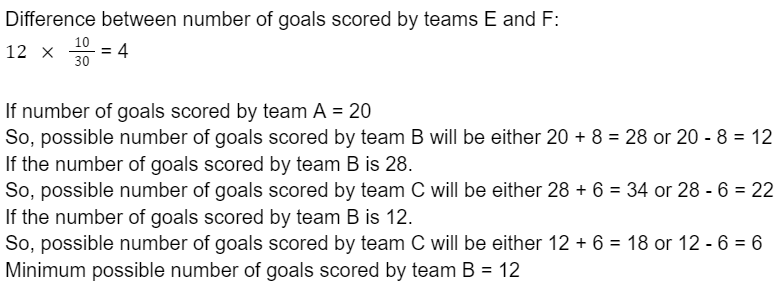
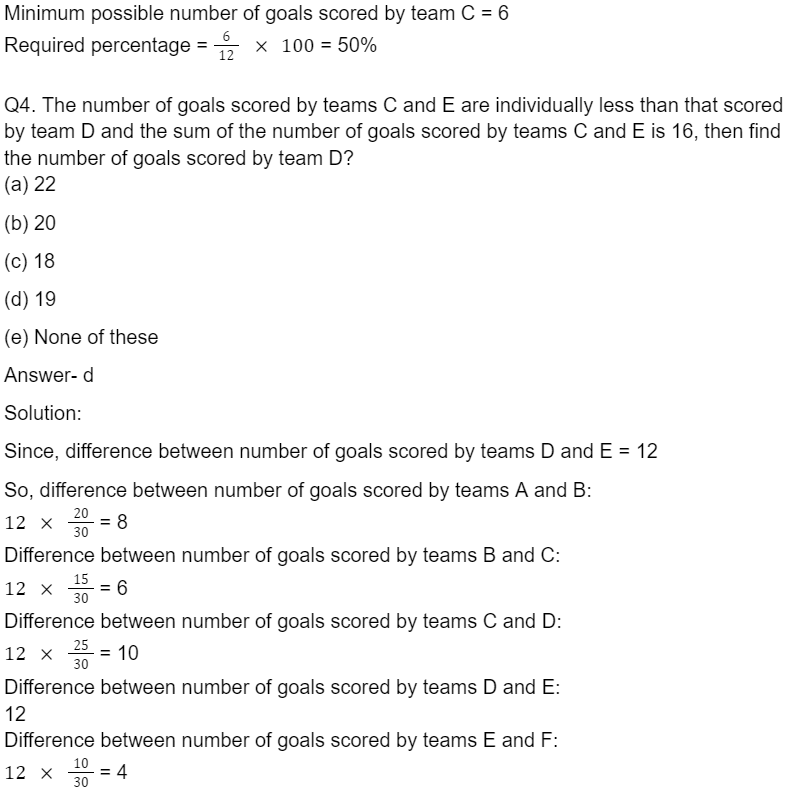
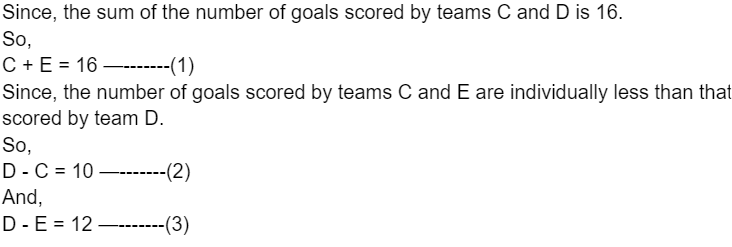
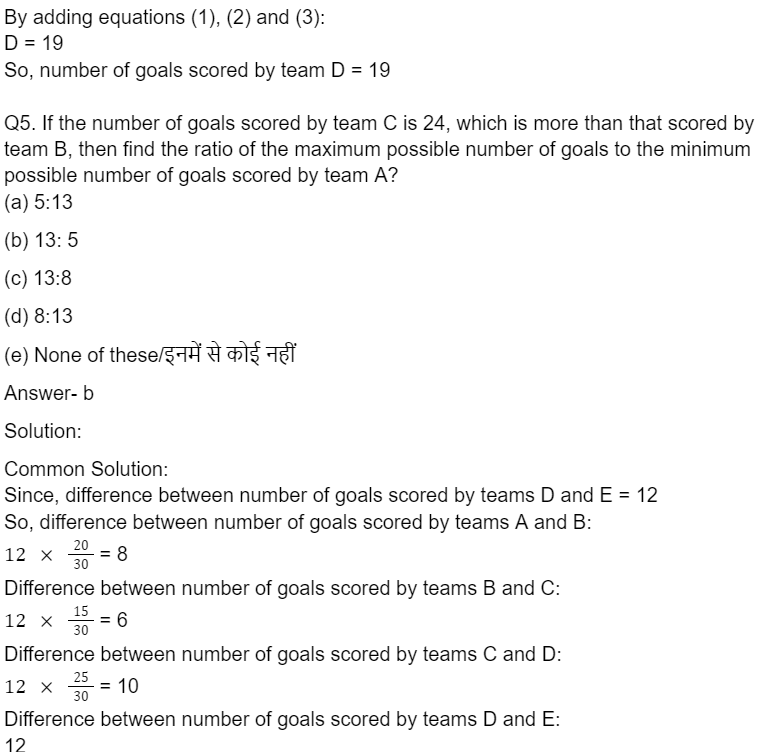
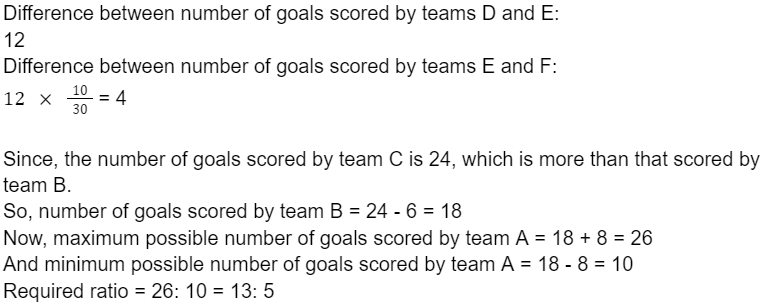
Directions(1-5): Answer the questions based on the information given below. Six teams A, B, C, D, E and F participated in a football tournament. Each of the given teams scored a different number of goals in the tournament. Pie chart given below shows the percentage distribution of following data.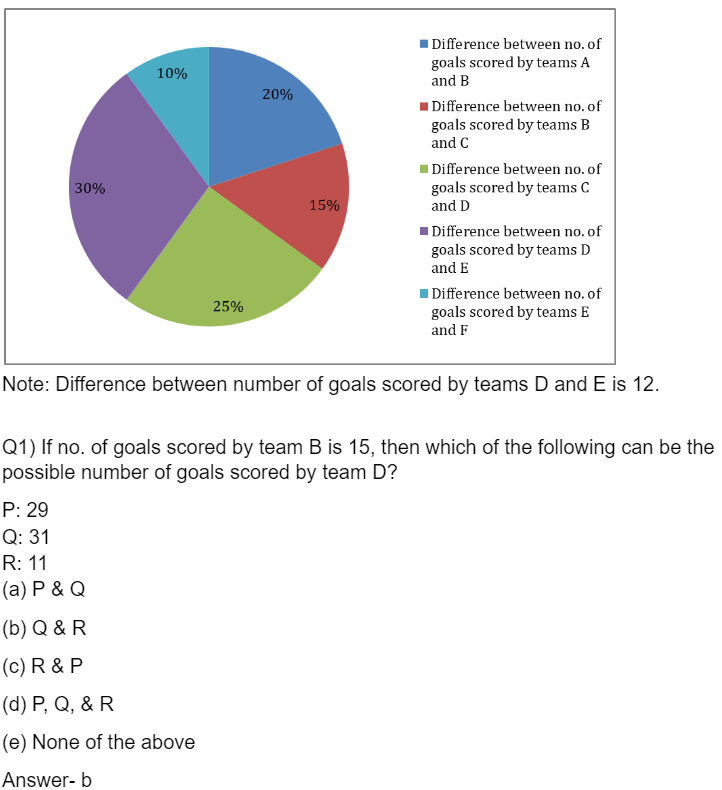
| Related Links | |
|---|---|
| Quadratic Equations | Number System |
| Vedic Maths | Pie Chart DI |
| Time and Work | Problem on Ages |
| Flow Chart DI | |
| Arithmetic DI | Permutation and Combination |
Pie Chart DI FAQs
Q1. What is a Pie Chart?
Ans. A Pie Chart is a pictorial representation of data. The slices of pie here show the relative sizes of data. The same data is represented in different sizes with the help of pie charts.
Q2. Why do we use pie charts?
Ans. Pie charts are used to represent the proportional data or relative data in a single chart. The concept of pie slices is used to show the percentage of a particular data from the whole pie.
Q3. How to calculate the percentage of data in the pie chart?
Ans, Measure the angle of each slice of the pie chart and divide by 360 degrees. Now multiply the value by 100. The percentage of particular data will be calculated.

🔥 Trending Blogs
Talk to a counsellorHave doubts? Our support team will be happy to assist you!

Check out these Related Articles


Join 15 Million students on the app today!

Free Learning Resources
PW Books
Notes (Class 10-12)
PW Study Materials
Notes (Class 6-9)
Ncert Solutions
Govt Exams
Our Other Websites
Class 6th to 12th Online Courses
Govt Job Exams Courses
UPSC Coaching
Defence Exam Coaching
Gate Exam Coaching
Other Exams
Know about Physics Wallah
Physics Wallah is an Indian edtech platform that provides accessible & comprehensive learning experiences to students from Class 6th to postgraduate level. We also provide extensive NCERT solutions, sample paper, NEET, JEE Mains, BITSAT previous year papers & more such resources to students. Physics Wallah also caters to over 3.5 million registered students and over 78 lakh+ Youtube subscribers with 4.8 rating on its app.
We Stand Out because
We provide students with intensive courses with India’s qualified & experienced faculties & mentors. PW strives to make the learning experience comprehensive and accessible for students of all sections of society. We believe in empowering every single student who couldn't dream of a good career in engineering and medical field earlier.
Our Key Focus Areas
Physics Wallah's main focus is to make the learning experience as economical as possible for all students. With our affordable courses like Lakshya, Udaan and Arjuna and many others, we have been able to provide a platform for lakhs of aspirants. From providing Chemistry, Maths, Physics formula to giving e-books of eminent authors like RD Sharma, RS Aggarwal and Lakhmir Singh, PW focuses on every single student's need for preparation.
What Makes Us Different
Physics Wallah strives to develop a comprehensive pedagogical structure for students, where they get a state-of-the-art learning experience with study material and resources. Apart from catering students preparing for JEE Mains and NEET, PW also provides study material for each state board like Uttar Pradesh, Bihar, and others
Copyright © 2026 Physicswallah Limited All rights reserved.