

Consumer Surplus Formula - Meaning, Examples

In economics, consumer surplus is defined as the gap between the price a customer is willing to pay for a product and the amount they actually shell out to receive the product.
There might be a positive or negative consumer surplus. And it’s beneficial if the market price of a product is beneath the price the client would want to pay. The customer’s willingness to pay is the maximum value the market price might be.
Consumer Surplus Meaning
Consumer surplus is an important economic term that indicates the difference between the price a customer is willing to pay for a product or service and the price actually paid. Simply expressed, it is the measure of the extra benefit customers obtain over and beyond the price they paid for an item or service.
Let's break it down: So, imagine you can’t wait to be able to get a new phone. You are willing to spend $800 for it since you believe it’s worth that much money to yourself. But luckily for you, this one is on sale for $600. The consumer surplus in this situation would be $200 ($800 - $600).
What is Producer Surplus?
Producer surplus is a fundamental economic concept that signifies the extra financial gain or profit obtained by producers or sellers when they sell a product or service at a price higher than their minimum acceptable price. In simpler terms, it measures the additional revenue producers earn beyond their production costs when they can sell their goods or services for a price greater than the minimum they are willing to accept.
Consumer Surplus Formula
Consumer Surplus Formula represents the difference between what consumers are willing to pay for a good or service and what they pay.
the formula for calculating consumer surplus:
Consumer Surplus (CS) = Maximum Willingness to Pay (WTP) - Actual Payment (AP)
Where:
- CS represents the consumer surplus.
- WTP is the highest price a consumer is willing to pay for a product or service.
- AP is the actual price paid by the consumer for that product or service.
How to Calculate Consumer Surplus
- The gap between the actual price paid and the maximum price that customers are prepared to pay shows the consumers' marginal benefit.
- Simply said, consumers may get products and services for less than the most they are willing to spend.
- The definition of a consumer surplus is drawn from the economic theory of marginal utility, which defines it as the extra benefit received by a customer from purchasing one more unit of an item or service.
- All else being equal, the bigger the supply of a commodity or service (i.e. the number of sellers and available alternatives) and the greater its accessibility, the more probable it is that customers already have it.
- Given a situation that favors buyers over sellers, the amount that customers are ready to spend on individuals who do not own the commodity or service tends to diminish.
- The following is the connection between price and consumer surplus:
- Increased Consumer Surplus as a Result of Higher Pricing
- Lower Prices Reduced Consumer Surplus
Consumer Surplus Graph
In economics, consumer surplus is illustrated graphically on a demand and supply curve. The demand curve represents the maximum price consumers are willing to pay for a good or service, while the supply curve represents the minimum price producers are willing to accept. The point where these curves intersect signifies the market equilibrium, where the quantity demanded equals the quantity supplied.
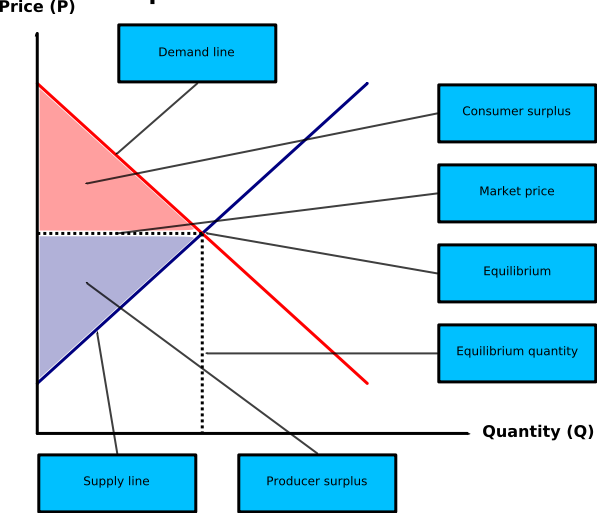
Demand Curve (D):
The demand curve slopes downwards, indicating that as the price decreases, the quantity demanded increases. This curve showcases the maximum price consumers are willing to pay for a specific quantity of the product.
Supply Curve (S):
The supply curve slopes upwards, indicating that as the price increases, the quantity supplied by producers also increases. This curve represents the minimum price producers are willing to accept for the same quantity of the product.
Market Equilibrium (E):
The point where the demand curve (D) and supply curve (S) intersect is the market equilibrium (E). At this point, the quantity demanded equals the quantity supplied, and the market is in balance.
Consumer Surplus Area:
The area between the demand curve (D) and the market price (P) up to the quantity bought (Q) represents the consumer surplus. This area signifies the difference between what consumers are willing to pay (as per the demand curve) and what they actually pay (the market price).
Consumer Surplus Example
Example 1: Buying a Book
Imagine a book lover is willing to pay 500 rupees for a novel he desires. He finds the book in a bookstore for 300 rupees. In this case, the consumer surplus is 200 rupees (500 - 300). The consumer gains an additional value of 200 rupees because he paid less than his maximum willingness to pay.
Example 2: Purchasing a Smartphone
A tech geek is willing to spend out 30,000 rupees for an updated smartphone. The identical smartphone is offered for 25,000 rupees during a deal. The consumer surplus would amount to 5,000 Rupees (30,000 - 25,000). This additional value is the excess owing to the price differential.
Consumer Surplus Formula FAQs
What Does Consumer Surplus Represent?
How is Consumer Surplus Calculated?
Why is Consumer Surplus Important in Economics?
Can Consumer Surplus Change Over Time?
Is Consumer Surplus the Same as Profit?