

Market Supply Curve: Definition, How It Works, and Example
The market supply curve is a fundamental concept in economics that depicts the relationship between a product's price and the total quantity that producers are willing to supply at various price levels. It provides critical insights into how producers respond to changes in market conditions and is essential for understanding the dynamics of supply and demand.
By examining the market supply curve, we can predict how factors such as production costs, technological advancements, and expectations of future prices influence the overall quantity supplied. This article delves into the workings of the market supply curve, exploring its implications for businesses, policymakers, and investors in making informed decisions.Market Supply Curve Definition
The supply curve illustrates the relationship between the cost of a product or service and the quantity available. It is typically shown on a graph with price on the vertical axis and quantity supplied on the horizontal axis. This curve visually represents the law of supply and demand, indicating that prices rise when supply is low. By analysing the supply curve, one can predict potential price changes based on demand. A shallower (more horizontal) supply curve indicates a more elastic supply, meaning the quantity supplied is highly responsive to price changes. Conversely, a steeper (more vertical) supply curve suggests a less elastic supply, where the quantity supplied is less responsive to price changes.
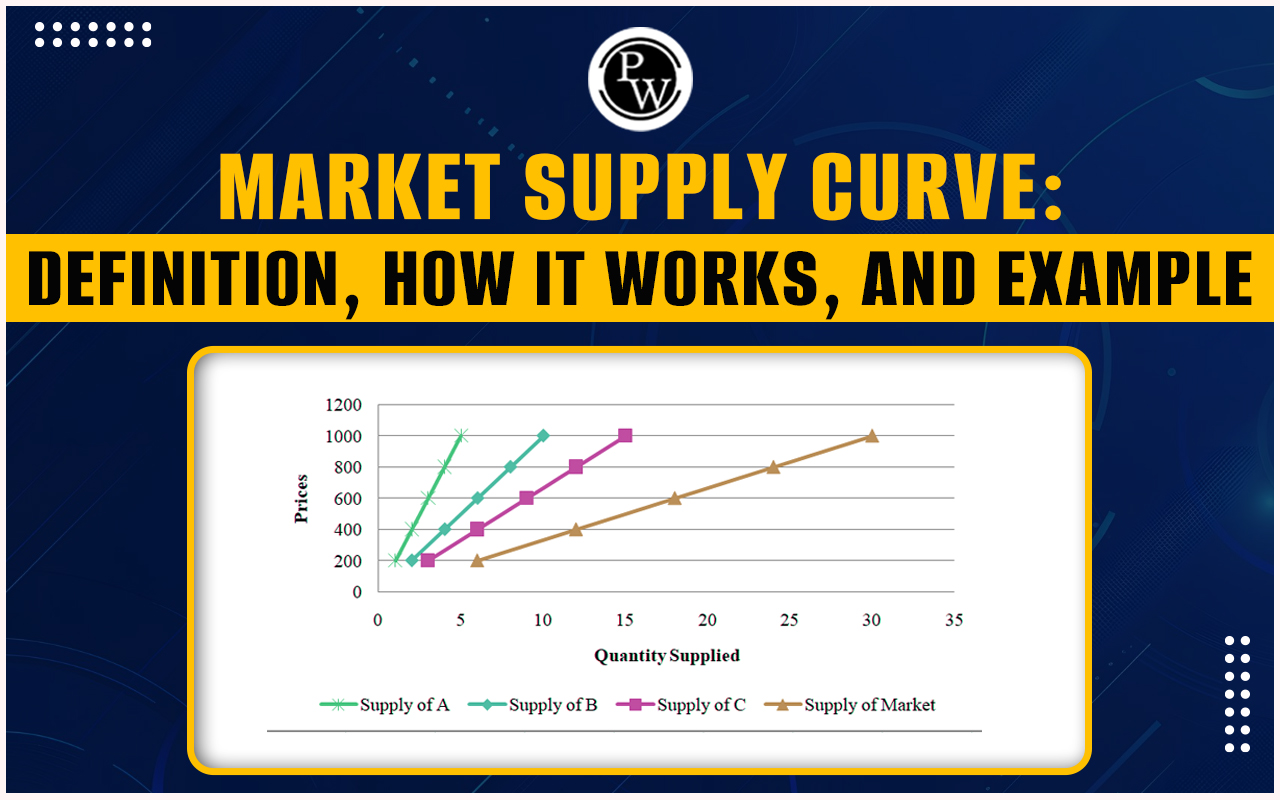
Formula: Market supply = sum of each individual producer supply
How the Market Supply Curve Works
The market supply curve represents the relationship between the price of a product and the total quantity that producers are willing and able to supply at various price levels, holding all other factors constant. Here's how it works: Upward Slope The market supply curve typically slopes upward from left to right. This upward slope indicates that as the price of a product increases, the quantity supplied also increases. This relationship is due to the law of supply: higher prices incentivise producers to supply more of the product to maximise profits. Price as the Independent Variable In the context of the supply curve, price is considered the independent variable, and quantity supplied is the dependent variable. Although the independent variable is usually on the horizontal axis in most disciplines, economics often places a price on the vertical axis. Factors That Can Shift the Supply Curve The supply curve can shift due to changes in factors other than the product's price:- Production Costs : If the cost of production increases (e.g., due to higher input prices), the supply curve will shift to the left, indicating a decrease in supply at each price level.
- Technological Advances : Improvements in technology can make production more efficient, shifting the supply curve to the right and indicating an increase in supply.
- Prices of Related Goods : If the price of a substitute good increases, producers might switch to producing that good, decreasing the supply of the original product and shifting the supply curve to the left.
- Expectations of Future Prices : If producers expect higher prices in the future, they might reduce current supply to sell more, shifting the supply curve to the left.
| Also Read | |
| Infrastructure In India During British Rule | Merits and Demerits of Fixed Exchange Rate System |
| Consumer Behavior and Marketing | Consumer Behavior Analysis |
Market Supply Curve Example
This table represents a hypothetical scenario where the quantity of oranges that producers are willing and able to sell (supply) increases as the price per unit increases. Here's an example of a market supply curve for oranges in India, with prices in rupees (₹):| Quantity Supplied (Units) | Price per Unit (₹) |
| 100 | 20 |
| 200 | 30 |
| 300 | 40 |
| 400 | 50 |
| 500 | 60 |
- At a lower price of ₹20 per orange, producers are only willing to supply 100 units. This might be because it barely covers production costs, or they might have limited resources to harvest and sell more at that price.
- As the price increases to ₹30 per orange, producers become incentivized to supply a higher quantity (200 units) as it becomes more profitable.
- The trend continues, with producers willing to supply even more oranges (up to 500 units) at a higher price of ₹60 per unit.
- If we plot this data on a graph with the quantity supplied on the X-axis and the price per unit on the Y-axis, we get a market supply curve. This curve generally slopes upwards, indicating a positive relationship between price and quantity supplied.
- Cost of Production : If the cost of fertilizers, pesticides, or labour increases, the supply curve might shift upwards, meaning producers are willing to sell less at the same price point.
- Government Policies : Subsidies for orange production could shift the supply curve downwards, making it cheaper for producers to sell at a lower price.
- Weather Conditions : A bad harvest due to unfavourable weather could decrease supply, causing the curve to shift upwards and to the left (less supply available at all price points).
Begin your journey towards academic excellence in Commerce with our comprehensive Class 11 Commerce courses . Master the CBSE syllabus with expert guidance and ace your exams. Enroll now!”
Market Supply Curve: Definition, How It Works, and Example FAQs
Can you provide an example for market supply curve?
What is the market supply curve?
What is the supply curve called?