

Shifts In The Demand Curve, meaning, and example
Shifts in the Demand Curve, happen when a change in any non-price factor affects the overall demand for a good or service.An increase in demand shifts the curve to the right, while a decrease in demand shifts it to the left.
Understanding shifts in the demand curve is fundamental in market dynamics and consumer behaviour. The demand curve, a graphical representation of the relationship between the price of a good and the quantity demanded, is not static. It can shift due to various factors that we will be reading in this article.
However, these shifts in the demand curve are crucial for businesses, policymakers, and economists as they indicate changes in market conditions and help make informed decisions. This article explores the meaning and definition of shifts in the demand curve, supplemented by real-world examples to illustrate these concepts.Shifts In The Demand Curve Meaning
A shift in the demand curve refers to a change in the quantity demanded of a good or service at every price level caused by factors other than the price of the good itself. This change is represented by moving the entire demand curve to the right or left. When the demand curve shifts to the right, it indicates increased demand, meaning consumers are willing to buy more of the good at all price levels. However, a shift to the left indicates a decrease in demand, meaning consumers are willing to buy less of the good at all price levels. These shifts are influenced by various factors such as changes in income, consumer preferences, prices of related goods, expectations, and demographic changes.Three Causes for Shifts in the Demand Curve
The shifts in the demand curve can be caused by various factors that reflect changes in consumer behaviour, preferences, and economic conditions. Here are three common causes for shifts in the demand curve:- Income Changes : Changes in consumer income levels can significantly impact the demand for goods and services. When incomes rise, consumers typically increase their demand for normal goods, leading to a rightward shift in the demand curve. However, during economic downturns or when incomes decrease, the demand for normal goods usually falls, resulting in a leftward shift. For inferior goods, the relationship is the opposite: an increase in income might lead to a decrease in demand, while a decrease in income could increase demand.
- Changes in Consumer Preferences : Shifts in consumer preferences and tastes can influence the demand for specific products. For example, growing awareness of health benefits can increase the demand for organic or healthier food products, causing a rightward shift in the demand curve. Conversely, if consumers move away from a particular style or product type, it can lead to a leftward shift. Changes in fashion trends, technological advancements, or societal values can all contribute to these shifts in demand.
- Price of Related Goods : Substitute and complementary goods can affect the demand for a particular product. If the price of a substitute good (an alternative product that fulfils a similar need) decreases, consumers may shift their demand away from the original product, causing a leftward shift. Conversely, if the price of a complementary good (a product used together with another) decreases, it can increase the demand for the original product, leading to a rightward shift. These relationships are captured by the concepts of cross-price elasticity of demand for substitutes and complements.
| Also Read | |
| Capital investment process | Market Supply Curve: Definition, How It Works, and Example |
| Short Run Supply Curve of a Firm | How To Calculate Total Variable Cost |
Movement Along the Demand Curve and shifts in the demand curve
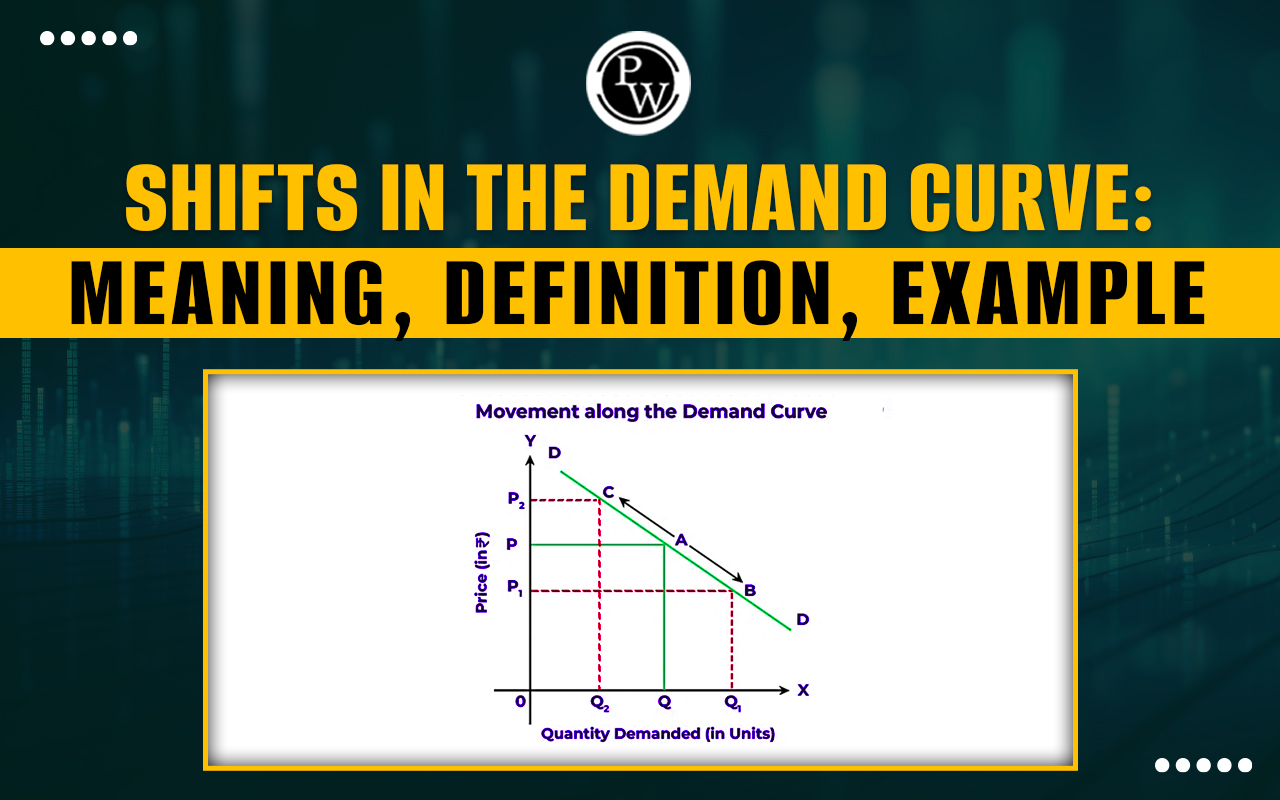
Movement Along the Demand Curve: A movement along the demand curve occurs when the quantity demanded of a good changes due to a change in its price while all other factors remain constant. This movement is illustrated by moving from one point to another on the same demand curve.- Price Increase : When the price of a good rises, the quantity demanded typically decreases, leading to an upward movement along the demand curve.
- Price Decrease : When the price of a good falls, the quantity demanded usually increases, resulting in a downward movement along the demand curve.
- Rightward Shift : The demand curve shifts to the right when demand increases. This can happen due to higher incomes (for normal goods), increased consumer preference for the good, a decrease in the price of a complementary good, an increase in the price of a substitute good, positive future expectations, or an increase in the number of buyers.
- Leftward Shift : When demand decreases, the curve shifts to the left. This can occur due to lower incomes (for normal goods), decreased consumer preference for the good, an increase in the price of a complementary good, a decrease in the price of a substitute good, negative future expectations, or a decrease in the number of buyers.
Types of Shifts In The Demand Curve
The demand curve can shift in two primary directions, each indicating a change in market conditions and consumer behaviour. These shifts are known as rightward shifts and leftward shifts. Rightward Shift in the Demand Curve : A rightward shift in the demand curve signifies increased demand at every price level. This shift means that consumers are now willing and able to purchase more of the good or service than before, regardless of the price. Factors that can cause a rightward shift include:- Increase in Income : Higher consumer incomes can increase demand for normal goods.
- Positive Change in Preferences: A greater consumer preference or increased product popularity can boost demand.
- Decrease in the Price of Complementary Goods : Lower prices of goods used together with the product can increase demand.
- Increase in the Price of Substitute Goods : Higher prices of alternative products can drive consumers to buy more of the original product.
- Positive Future Expectations : Expectations of higher future prices or scarcity can prompt consumers to buy more now.
- Increase in Population : A larger market size can increase overall demand.
- Decreased Income : Lower consumer incomes can reduce demand for normal goods.
- Negative Change in Preferences : Decreased consumer preference or declining product popularity can reduce demand.
- Increase in the Price of Complementary Goods : Higher prices of goods used together with the product can decrease its demand.
- Decrease in the Price of Substitute Goods : Lower prices of alternative products can drive consumers to buy less of the original product.
- Negative Future Expectations : Expectations of lower future prices or surplus can prompt consumers to delay purchases.
- Decrease in Population : A smaller market size can decrease overall demand.
- Understanding these types of shifts in the demand curve is crucial for analysing market trends, making business decisions, and formulating economic policies.
Example Of Shifts In The Demand Curve
These examples illustrate how various factors can cause the demand curve to shift either to the right or the left, reflecting changes in the quantity demanded at each price level due to changes in income, consumer preferences, and the prices of related goods. Increase in Income: Example : Suppose the average income of consumers increases due to economic growth. As a result, people have more disposable income to spend on goods and services. For instance, if incomes rise, consumers may buy more luxury cars. This increased purchasing power shifts the demand curve for luxury cars to the right, indicating a higher quantity demanded at each price level. Positive Change in Preferences : Example : Imagine a new health trend promoting the benefits of eating avocados. As more people become health-conscious, their preference for avocados increases. This heightened demand causes the demand curve to shift to the right, reflecting a higher quantity demanded at each price level. Decrease in the Price of Complementary Goods: Example : Consider the market for smartphones and their accessories. Suppose the price of smartphone accessories (like cases or earphones) drops significantly. In that case, the demand for smartphones might increase because the overall cost of owning and accessing a smartphone becomes more affordable. This leads to a rightward shift in the demand curve for smartphones. Leftward Shift in the Demand Curve : Decrease in Income: Example : During a recession, consumers' average incomes may decrease. With less disposable income, people reduce their spending on non-essential goods. For example, the demand for dining out at restaurants might decline. This reduction in income shifts the demand curve for restaurant meals to the left, indicating a lower quantity demanded at each price level. Negative Change in Preferences : Example : Suppose a new study reveals significant health risks associated with consuming sugary drinks. As a result, consumer preferences shift away from sugary drinks, decreasing their popularity. This change in preference causes the demand curve for sugary drinks to shift to the left, reflecting a lower quantity demanded at each price level. Increase in the Price of Complementary Goods: Example : Take the market for printers and printer ink. If the price of printer ink significantly increases, the cost of using a printer becomes more expensive. Consequently, the printer demand might decrease as people look for more cost-effective alternatives. This results in a leftward shift in the demand curve for printers. Begin your journey towards academic excellence in Commerce with our comprehensive Commerce courses . Master the CBSE syllabus with expert guidance and ace your exams. Enroll now!”Shifts In The Demand Curve FAQs
What happens when the demand curve changes?
When the demand curve changes, it shifts to the right or left. This shift represents a change in demand at every price level, commonly called a shift in the demand curve. A rightward shift indicates an increase in demand, while a leftward shift indicates a decrease in demand.
What causes an outward shift of the production possibilities curve (PPC)?
An outward shift of the PPC occurs when there is an increase in the quantity or quality of production factors. This means that the economy can produce more goods and services than before


🔥 Trending Blogs
Talk to a counsellorHave doubts? Our support team will be happy to assist you!

Check out these Related Articles


Join 15 Million students on the app today!

Free Learning Resources
PW Books
Notes (Class 10-12)
PW Study Materials
Notes (Class 6-9)
Ncert Solutions
Govt Exams
Our Other Websites
Class 6th to 12th Online Courses
Govt Job Exams Courses
UPSC Coaching
Defence Exam Coaching
Gate Exam Coaching
Other Exams
Know about Physics Wallah
Physics Wallah is an Indian edtech platform that provides accessible & comprehensive learning experiences to students from Class 6th to postgraduate level. We also provide extensive NCERT solutions, sample paper, NEET, JEE Mains, BITSAT previous year papers & more such resources to students. Physics Wallah also caters to over 3.5 million registered students and over 78 lakh+ Youtube subscribers with 4.8 rating on its app.
We Stand Out because
We provide students with intensive courses with India’s qualified & experienced faculties & mentors. PW strives to make the learning experience comprehensive and accessible for students of all sections of society. We believe in empowering every single student who couldn't dream of a good career in engineering and medical field earlier.
Our Key Focus Areas
Physics Wallah's main focus is to make the learning experience as economical as possible for all students. With our affordable courses like Lakshya, Udaan and Arjuna and many others, we have been able to provide a platform for lakhs of aspirants. From providing Chemistry, Maths, Physics formula to giving e-books of eminent authors like RD Sharma, RS Aggarwal and Lakhmir Singh, PW focuses on every single student's need for preparation.
What Makes Us Different
Physics Wallah strives to develop a comprehensive pedagogical structure for students, where they get a state-of-the-art learning experience with study material and resources. Apart from catering students preparing for JEE Mains and NEET, PW also provides study material for each state board like Uttar Pradesh, Bihar, and others
Copyright © 2026 Physicswallah Limited All rights reserved.