

Tree Diagram In Probability, Illustration, Important Topics For JEE Main 2024
Tree Diagram In Probability : Tree diagram helps in various section such as computer science and business problems. Use of tree diagram in probability helps in solving various critical problems which gets easy to elaborate if done using tree diagram. Tree used here are inverted, means it started from root in reverse order grows from top to bottom.
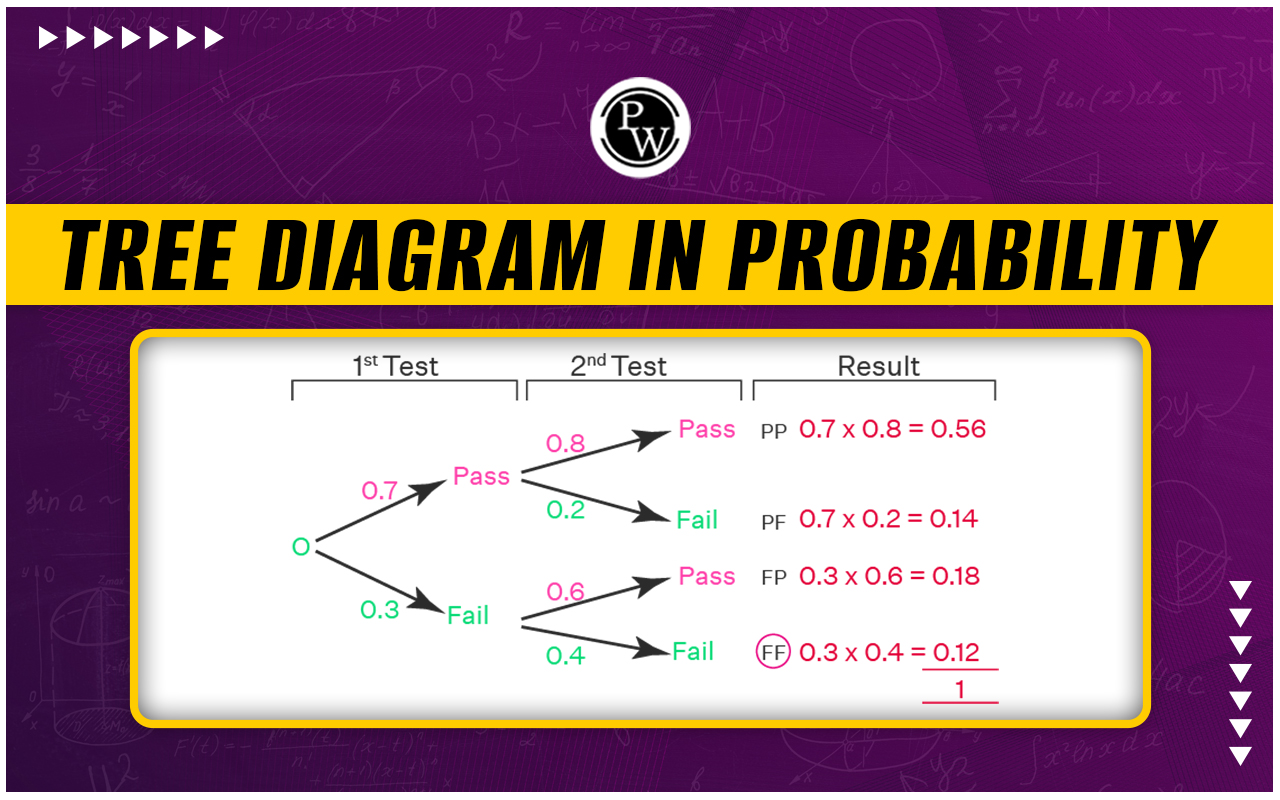
It has mainly four parts root, branch, node and leaf. Root shows an event Branch shows respective Probabilities of the event node shows next event of the experiment, leaf node shows the final probability for a particular set of events. For example, let a coin is tossed two times it’s tree diagram could be illustrated as
Root: it shows first event of tossing the coin
Branch: It shows two branches respective probabilities of outcomes such as probabilities of head and tail.
Node: It show next event of tossing the coin.
Leaf Node: It shows final probabilities of each path individually.

Tree diagram also helps in conditional probability and independent events dictation. Such as if from a bag having 5 red and 4 green balls 2 ball are drawn in succession without replacement the we have to find the probability of getting second ball as green. Here tree dictation would be as
Root: it shows event of withdrawing the first ball.
Branch: It shows two branches with respective probabilities of outcomes such as probabilities of red and green ball.
Node: It show next event of withdrawing the ball.
Leaf Node: It shows final probabilities of each path individually.

Now to calculate the final probability we can add the paths probability which has node event as withdrawing the second green ball.
Tree Diagram In Probability Introduction
As discussed, tree diagram helps in dictating hard probability problems in easy manner let’s explore the with examples.
Tree Diagram In Probability Based Examples
Example 1: If two letters are selected from the word WILLOW find the probability of getting vowel in at least one selection using tree diagram?
Sol. Root: it shows event of getting the first letter.
Branch: It shows two branches respective probabilities of outcomes such as probabilities of vowels and consonants.
Node: It show next event of getting the letter.
Leaf Node: It shows final probabilities of each path individually.

Probability of whole experiment for favourable event would be
Example 2 : A person has to reach the office by using three modes of transportation such as bus train and auto he wants to reach office in time probabilities of him getting late through bus, train and auto are respectively as .2, .3 .5 here selection of any mode of transportation is equiprobable find the probability of him reaching office on time using tree diagram?
Sol.
Modes of transportation are bus, Train and Auto probability of selection of each would be
Now this situation could be elaborated as.
Root: it shows event of getting any of the transport mode.
Branch: It shows three branches with respective probabilities of outcomes such as probabilities of selecting bus train and auto.
Node: It show next event of reaching the office.
Leaf Node: It shows final probabilities of each path individually.

Probability of whole experiment for favourable event would be
Example 3: If a pair of unbiased dice is rolled and sum of numbers appearing is 8 find the probability of having 5 in at least one dice using tree diagram?
Sol. We have pair of unbiased dice each with six faces marked as {1, 2, 3, 4, 5, 6} Now its tree diagram could be elaborated as
Root: it shows event of rolling both dices.
Branch: It shows two branches respective probabilities of outcomes (5, 3) and (3, 5).
Leaf Node: It shows final probabilities of each path individually.

Probability of whole experiment for favourable event would be
Tree Diagram in Probability Based Rapid Questions
1. If a pair of unbiased dice is rolled and sum of numbers appearing is 10 find the probability of having even number in at least one dice using tree diagram?
2. Find Probability of selecting at least one consonant from INDEPENDENT in two consecutive selections using tree diagram?
Advance illustration based on tree diagram in Probability
1. If an unbiased coin is tossed and an unbiased dice is rolled find the probability of getting even number on the dice using tree diagram?
Sol. Unbiased coin would have two outcomes as {H, T} and an unbiased dice has six outcomes as {1, 2, 3, 4, 5, 6} Now Total outcomes possible would be as {H1, H2, H3, H4, H5, H6, T1, T2, T3, T4, T5, T6} Now its tree diagram could be elaborated as
Root: it shows event of tossing the coin.
Branch: It shows two branches respective probabilities of outcomes such as probabilities of head and tail.
Node: It show next event of rolling the dice.
Branch: It shows two branches with respective probabilities of even and odd number.
Leaf Node: It shows final probabilities of each path individually.

Probability of favourable event would be as
Tree Diagram in Probability Based Rapid Questions
1. If an unbiased coin is tossed and two unbiased dices are rolled find the probability of getting even number on both dices using tree diagram?
2. If two numbers are chosen from set of numbers [1, 2, 3, 4, 5, 6, 7} consecutively find probability of selecting one even and one odd number using tree diagram?
Tree Diagram in Probability FAQs
Q.1: Tree diagram has mainly four components as Root, Node, Branch and Leaf?
Q.2: Tree diagram in probability always starts with leaf node?
Q.3: Conditional events, independent events represent two different quantities?
Q.4 : Probability of any event cannot go beyond 1?