

Displacement Time Graph Formula, Definition, Concepts and Examples

The displacement time graph is a graphical representation that shows how the position of an object changes over time. It provides insights into the object's motion, speed, and direction. Let's dive into the full topic of displacement-time graphs:
1. Understanding Displacement and Time
- - Displacement: Displacement is the change in position of an object from its initial point to its final point. It includes both distance and direction.
- - Time: Time is the duration during which the object is in motion.
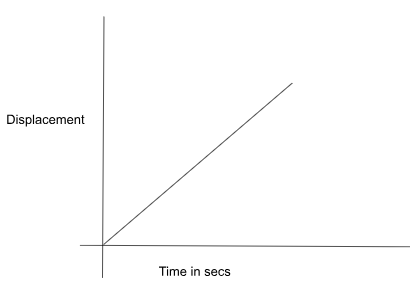
2. Creating a Displacement-Time Graph
- - On a graph, the horizontal axis (x-axis) represents time, while the vertical axis (y-axis) represents displacement.
- - As time progresses, the object's displacement is recorded at various intervals.
Also Check - Wind Energy Formula
3. Interpreting Displacement-Time Graphs
- - Straight Line: A straight line indicates constant velocity motion. The steeper the line, the greater the speed.
- - Upward Slope: Positive slope indicates forward motion (displacement increasing with time).
- - Downward Slope: Negative slope indicates backward motion (displacement decreasing with time).
- - Flat Line: A flat line indicates zero displacement, i.e., the object is at rest.
- - Curved Line: A curved line implies changing velocity or acceleration.
4. Characteristics and Information
- - Gradient (Slope): The gradient of the graph represents the object's velocity. steeper slope = higher velocity.
- - Horizontal Line: If the line is horizontal, the object is stationary (velocity is zero).
- - Area Under the Graph: The area under the graph represents the total displacement during the given time interval.
Also Check - Centre Of Mass Formula
5. Examples
- - Constant Velocity: A straight line with a consistent slope indicates constant velocity. For instance, a car moving at a steady speed on a straight road.
- - Acceleration: A curved line indicates changing velocity. Steeper curves represent greater acceleration.
- - Motion and Rest: A jagged line that crosses the x-axis suggests the object is changing direction, reversing its motion, or coming to a stop.
6. Calculating Velocity from the Graph
- - To calculate velocity, find the change in displacement over the change in time.
- - Velocity = (Change in displacement) / (Change in time).
- - Alternatively, velocity is the gradient of the graph (rise over run).
Also Check - Speed and Velocity Formula
7. Real-World Applications
- - Displacement time graphs find applications in various fields, from physics and engineering to sports analysis and transportation planning.
- - They help visualize and analyze motion patterns, track changes in position, and predict future positions of objects in motion.
8. Limitations and Considerations
- - Displacement time graphs assume continuous motion, but real-world situations might involve irregular motion or stops and starts.
- - Acceleration and changes in velocity might not always be accurately represented by simple straight or curved lines.
Displacement time graphs are valuable tools for understanding an object's motion, velocity, and changes in direction over a given time period. They offer insights into the dynamic behavior of objects and are a fundamental concept in physics and motion analysis. By studying these graphs, we can unlock a deeper understanding of how things move and interact in the world around us.
Also Check - Equation of Motion in One Dimension Formula
Applications
Here are some practical applications of displacement-time graphs:
- Physics Education:
Displacement time graphs are commonly used in physics classrooms to teach students about motion, velocity, and acceleration. They provide a visual representation that helps students understand the relationship between displacement and time.
- Sports Analysis:
Displacement time graphs can be used to analyze the performance of athletes in sports. For example, in sprinting, a graph of an athlete's displacement over time can help coaches identify acceleration phases, maximum velocities, and any changes in speed during the race.
- Transportation Planning:
Displacement time graphs play a role in transportation planning and traffic engineering. They help in understanding the movement of vehicles, predicting congestion patterns, and optimizing traffic flow.
- Video Game Design:
Video game designers use displacement time graphs to create realistic motion for characters and objects within the game. Graphs can simulate various types of motion, such as walking, running, jumping, and flying.
- Animation and Film Industry:
Animators and filmmakers use displacement time graphs to create realistic motion for characters and objects in animated movies or special effects sequences. Graphs assist in achieving smooth and natural-looking movements.
- Robotics and Automation:
In robotics, displacement time graphs help programmers and engineers plan the motion of robots. They aid in designing paths that robots should follow to perform tasks accurately and efficiently.
- Vehicle Dynamics:
In automotive engineering, displacement-time graphs are used to analyze the motion of vehicles during braking, acceleration, and turning. Engineers can optimize vehicle performance and safety by studying these graphs.
- Spacecraft Trajectories:
Displacement time graphs are used to plan and analyze the trajectories of spacecraft and satellites. They help space agencies ensure that spacecraft follow desired paths and arrive at their destinations accurately.
- Physics Research:
Researchers in the field of physics use displacement time graphs to analyze the behavior of particles in high-energy accelerators. These graphs aid in understanding particle interactions and the fundamental forces of nature.
- Emergency Response and Search Operations:
In emergency response scenarios, such as tracking the movement of a lost hiker or a moving object in search and rescue operations, displacement-time graphs can assist in predicting future locations and optimizing search efforts.
- Robotics Surgery:
In robotic surgery, surgeons use displacement time graphs to understand and control the motion of robotic instruments. This precision helps in performing delicate surgical procedures.
- Construction Planning:
In construction projects, displacement-time graphs can aid in planning the movement of heavy machinery, cranes, and equipment to optimize construction timelines and safety.
- Geographical Studies:
In geographical studies, displacement-time graphs can be used to analyze the movement of glaciers, tides, and other natural phenomena over time.
Displacement time graphs offer a versatile tool for analyzing and predicting the motion of objects in various fields, contributing to improved efficiency, safety, and understanding of physical processes.
Displacement Time Graph Formula FAQs
What is a displacement-time graph?
What does the slope of a displacement-time graph represent?
How can I determine the object's velocity from a displacement-time graph?
What does a horizontal line on a displacement-time graph indicate?
What does a positive slope on a displacement-time graph mean?
What does a negative slope on a displacement-time graph mean?
How can I calculate the total displacement from a displacement-time graph?
What does a curved line on a displacement-time graph represent?