

Effect size Formula, Definition, Calculation, Types and FAQs

Effect size Formula is a critical concept in statistics and research methodology that helps us quantify the magnitude of the differences or associations between variables. While p-values and significance testing are commonly used to determine whether an effect is statistically significant, the effect size Formula complements these measures by providing insight into the practical or real-world significance of the results. This comprehensive guide will explore the concept of effect size, its importance, different effect size measures, how to calculate them, and frequently asked questions.
Definition of Effect Size Formula
Effect size Formula is a numerical measure that quantifies the strength of a relationship between variables or the magnitude of a difference between groups in a study. It allows researchers to answer questions like:
How large is the impact of a new teaching method on student performance?
What is the strength of the association between two variables, such as income and education level?
How much do two groups differ in terms of their response to a treatment?
In essence, effect size helps researchers move beyond the question of whether an effect exists (as addressed by significance testing) to how substantial or meaningful that effect is in practical terms.
How do you calculate effect size?
There are dozens of measures for effect sizes. The most common effect size Formula are Cohen’s d and Pearson’s r. Cohen’s d measures the size of the difference between two groups while Pearson’s r measures the strength of the relationship between two variables.
Cohen's d Effect Size Formula
Cohen's d is a widely used effect size measure when comparing two groups, such as in experimental or comparative studies. It quantifies the standardized mean difference between these groups. In essence, it tells you how many standard deviations the means of two groups differ by. Here's how Cohen's d is calculated:
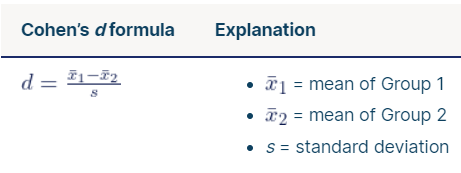
The choice of standard deviation in the equation depends on your design. You can use:
- a pooled standard deviation that is based on data from both groups,
- the standard deviation from a control group, if your design includes a control and experimental group the standard deviation from the pretest data, if your repeated measures design includes a pretest and posttest.
 Effect Size Formula[/caption]
Pearson's r Effect Size Formula
Pearson's r, also known as the correlation coefficient, quantifies the degree of a linear relationship between two variables.
The formula for calculating Pearson's r can be quite intricate, making it advisable to utilize statistical software for accurate computations when working with raw data.
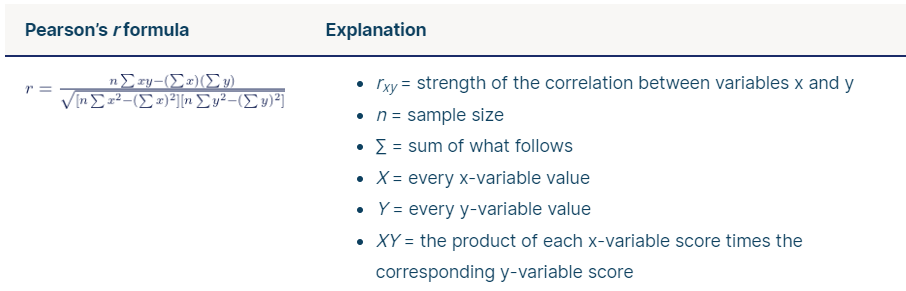
The fundamental concept behind the formula is to assess the extent to which changes in one variable are associated with changes in another variable.
Pearson's r provides a standardized measure for evaluating correlations between variables, rendering it unitless. This allows for direct comparisons of the magnitudes of correlations across different studies or datasets.
It's important to note that Pearson's r, much like Cohen's d, is applicable only to interval or ratio variables. When dealing with ordinal or nominal variables, alternative effect size measures are necessary.
How do you know if an effect size is small or large?
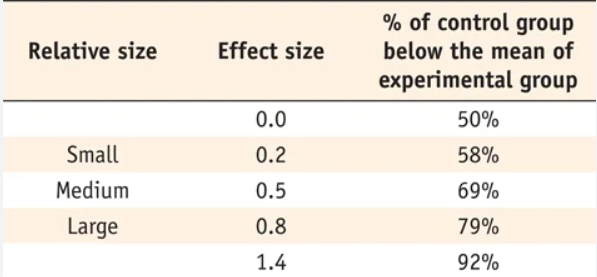
Effect sizes can be classified as small, medium, or large based on Cohen's criteria, and the specific categorization varies depending on the type of effect size measurement being used.
Effect Size Categories:
Pearson's r:
Small: 0.1 to 0.3 (or -0.1 to -0.3)
Medium: 0.3 to 0.5 (or -0.3 to -0.5)
Large: 0.5 or greater (or -0.5 or less)
It's important to note that while Cohen's d can take on any value between 0 and infinity, Pearson's r is bounded between -1 and 1.
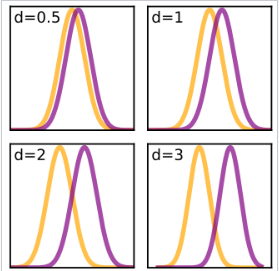
In general, for Cohen's d, a greater value indicates a larger effect size. Conversely, for Pearson's r, values closer to 0 signify a smaller effect size, whereas values closer to -1 or 1 indicate a stronger effect size.
Additionally, Pearson's r provides information about the direction of the relationship between variables:
A positive value (e.g., 0.7) suggests that both variables tend to increase or decrease together.
A negative value (e.g., -0.7) suggests that one variable increases as the other decreases (or vice versa).
It's worth noting that the criteria for what constitutes a small or large effect size may vary depending on the prevailing research norms in a specific field. Therefore, when interpreting effect sizes, it's advisable to consult other studies in your field for context and comparison.
Effect Size Formula Importance
Understanding why effect size is essential is crucial for researchers and practitioners:
- Contextualizes Significance: Significance testing can lead to "statistically significant" results that are not practically meaningful. Effect size provides context by indicating the size of the effect in real-world terms.
- Comparability: Effect size allows for the comparison of results across studies. Researchers can assess whether similar interventions or variables have similar effect sizes, regardless of sample size or statistical significance.
- Sample Size Justification: It helps in determining the required sample size for a study. A smaller effect size may necessitate a larger sample size to achieve statistical significance.
- Policy and Decision-Making: Effect size is critical in fields like education and medicine, where policymakers and practitioners need to make informed decisions about interventions, treatments, or policies.
Effect Size Formula Common Measures
Several effect size measures exist, each suited to different types of data and research questions. Here are some of the most common ones:
Cohen's d: This is used when comparing two groups (e.g., treatment vs. control) and measures the standardized mean difference. It quantifies how many standard deviations the means of the two groups differ.
Eta-squared (2η 2 ): It's used in the analysis of variance (ANOVA) and measures the proportion of variance in the dependent variable explained by an independent variable. It ranges from 0 to 1.
Phi (φ) and Cramer's V: These are used for categorical data and measure the strength of association between variables. Phi is for 2x2 contingency tables, while Cramer's V extends to larger tables.
Correlation Coefficients (r): Measures like Pearson's r, Spearman's rho, and Kendall's tau quantify the strength and direction of the relationship between two continuous variables.
Odds Ratios: Commonly used in epidemiology and medical research, odds ratios measure the odds of an event occurring in one group compared to another.
| Related Links | |
| Covariance Formula | Decay Formula |
| Cp Formula | Derivative Formula |
Effect size Formula
Why is effect size important when p-values indicate significance?
What is a "small," "medium," or "large" effect size?
Can effect size be negative?
Are larger effect sizes always better?
What's the relationship between power and effect size?