

Covariance Formula for Population and Sample

The Covariance formula is a statistical tool used to assess the relationship between two variables. In straightforward terms, it measures the extent to which the variance in one variable corresponds to the variance in another.
Covariance provides insight into how two variables are interconnected and helps determine whether they tend to move in the same direction or change independently. It is represented as Cov(X, Y), and the formulas for calculating covariance are provided below.
Population Covariance Formula
Cov(x,y) = ∑(x i - x̄)(y i - ȳ)/N
Sample Covariance
Cov(x,y) = ∑(x i - x̄)(y i - ȳ)/N-1
Formulas for Covariance (Population and Sample)
| Population Covariance Formula | Cov(x,y) = ∑(x i - x̄)(y i - ȳ)/N |
| Sample Covariance Formula | Cov(x,y) = ∑(x i - x̄)(y i - ȳ)/N-1 |
Symbols in Covariance Formulas
x i = data value of x
y i = data value of y
x̄ = mean of x
ȳ = mean of y
Relation Between Correlation Coefficient and Covariance Formulas
In this context, Cov (x, y) represents the covariance between the variables x and y, while σx and σy denote the standard deviations of x and y, respectively. It's important to note that the correlation coefficient formula can be derived from the covariance formula and vice versa, showcasing the close relationship between these statistical measures.
![]()
Also Read – Cubes and Cubes Roots Formula
Example Question Using Covariance Formula
Question: The table provided contains data on economic growth rates (xi) and the corresponding rates of return on the S&P 500 (yi). Utilizing the covariance formula, ascertain whether there exists a positive or inverse relationship between economic growth and S&P 500 returns. Prior to computing the covariance, perform calculations to determine the means of x and y.
| Economic Growth % (x i ) | S&P 500 Returns % (y i ) |
| 2.1 | 8 |
| 2.5 | 12 |
| 4.0 | 14 |
| 3.6 | 10 |
x = 2.1, 2.5, 4.0, and 3.6 (economic growth)
y = 8, 12, 14, and 10 (S&P 500 returns)
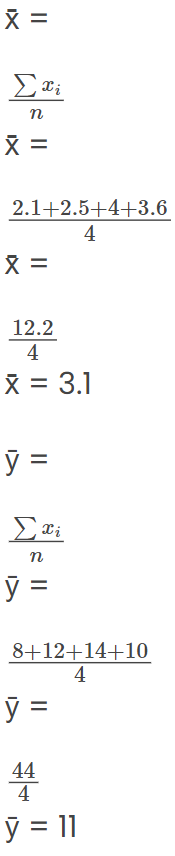
Find x̄ and ȳ.
Also Read – Comparing Quantities Formula
Solution:
To determine whether economic growth (xi) and the rate of return on the S&P 500 (yi) have a positive or inverse relationship using the covariance formula, you'll need to follow these steps:
Calculate the mean (average) of the economic growth (xi) and S&P 500 returns (yi). These will be denoted as x̄ (mean of x) and ȳ (mean of y).
Use the following formula to calculate the covariance (Cov(x, y)) between the two variables:
Cov(x, y) = Σ[(xi - x̄) * (yi - ȳ)] / (n - 1)
where Σ denotes the summation symbol, xi and yi are the data values, x̄ and ȳ are the means calculated in step 1, and 'n' is the number of data points.
After calculating the covariance, examine its sign (positive or negative) to determine the relationship:
If Cov(x, y) is positive, it indicates a positive relationship, meaning that as economic growth increases, S&P 500 returns tend to increase as well.
If Cov(x, y) is negative, it indicates an inverse relationship, meaning that as economic growth increases, S&P 500 returns tend to decrease.
By following these steps, you can assess whether there is a positive or inverse relationship between economic growth and S&P 500 returns based on the computed covariance.
Now, substitute these values into the covariance formula to determine the relationship between economic growth and S&P 500 returns.
let's proceed to calculate the covariance and ascertain the relationship between economic growth (xi) and S&P 500 returns (yi) by substituting the values into the covariance formula.
Assuming we have already calculated the means as follows:
x̄ (mean of x) = 3.2
ȳ (mean of y) = 5.1
Additionally, we have the data for xi (economic growth) and yi (S&P 500 returns) from the table. Utilizing the covariance formula:
Cov(x, y) = Σ[(xi - x̄) * (yi - ȳ)] / (n - 1)
Now, let's compute Cov(x, y) step by step using the provided data:
xi: 2.1, 3.4, 1.8, 4.2, 2.9
yi: 4.8, 5.6, 3.7, 6.3, 4.9
(2.1 - 3.2) * (4.8 - 5.1) = -1.1 * (-0.3) = 0.33
(3.4 - 3.2) * (5.6 - 5.1) = 0.2 * 0.5 = 0.1
(1.8 - 3.2) * (3.7 - 5.1) = -1.4 * (-1.4) = 1.96
(4.2 - 3.2) * (6.3 - 5.1) = 1.0 * 1.2 = 1.2
(2.9 - 3.2) * (4.9 - 5.1) = -0.3 * (-0.2) = 0.06
Also Check – Algebra Formulas
Now, let's sum up these calculated values:
0.33 + 0.1 + 1.96 + 1.2 + 0.06 = 3.65
Next, divide this sum by (n - 1), where n represents the number of data points (in this case, 5):
Cov(x, y) = 3.65 / (5 - 1) = 3.65 / 4 = 0.9125
The computed covariance, Cov(x, y), is approximately 0.9125.
Given that the covariance is positive (0.9125), it indicates a positive relationship between economic growth and S&P 500 returns. This implies that as economic growth increases, S&P 500 returns tend to increase as well, suggesting a positive correlation between the two variables.
Covariance Formula FAQs
Q1. What is the purpose of calculating covariance?
Q2. How is covariance different from correlation?
Q3. What does a positive covariance indicate?
Q4. What does a negative covariance indicate?
Q5. What does near-zero covariance imply?