

RS Aggarwal Solutions for Class 10 Maths Chapter 9 Exercise 9.4
In this article we have provided RS Aggarwal Solutions for Class 10 Maths Chapter 9 Exercise 9.4 prepared by our experts to help students to prepare better for their examinations.
RS Aggarwal Solutions for Class 10 Maths Chapter 9 Exercise 9.4: RS Aggarwal Solutions for Class 10 Maths Chapter 9 Exercise 9.4 help students learn about histograms, which are graphical representations of data.
By practicing these exercises, students can improve their ability to visually present and analyze data. These solutions are designed to be easy to understand and are a helpful resource for students preparing for exams, providing thorough practice in using histograms for data representation in statistics.RS Aggarwal Solutions for Class 10 Maths Chapter 9 Exercise 9.4 Overview
The RS Aggarwal Solutions for Class 10 Maths Chapter 9 Exercise 9.4 were created by experts from Physics Wallah. These solutions explain how to work with histograms, which show data in bars. They give clear steps to help you understand how to make and read histograms easily. By using these solutions you can get better at seeing and analyzing data visually. They are made to be easy to understand and helpful for preparing for exams where you need to use histograms to show data in statistics.RS Aggarwal Solutions for Class 10 Maths Chapter 9 Exercise 9.4 PDF
The PDF link for RS Aggarwal Solutions for Class 10 Maths Chapter 9 Exercise 9.4 is available below. By using this PDF, students can learn how to create and interpret histograms effectively, enhancing their skills in visualizing and analyzing data. This resource is invaluable for students preparing for their math exams, providing comprehensive practice and guidance in using histograms for data representation in statistics.RS Aggarwal Solutions for Class 10 Maths Chapter 9 Exercise 9.4 PDF
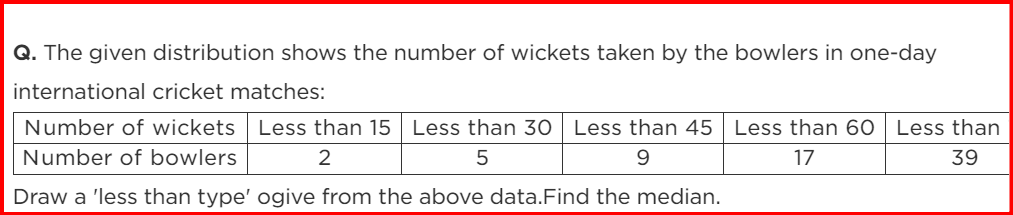
RS Aggarwal Solutions for Class 10 Maths Chapter 9 Mean Median Mode Of Grouped Data Cumulative Frequency Graph And Ogive Exercise 9.4
Here we have provided RS Aggarwal Solutions for Class 10 Maths Chapter 9 Exercise 9.4 for the ease of students so that they can prepare better for their exams.
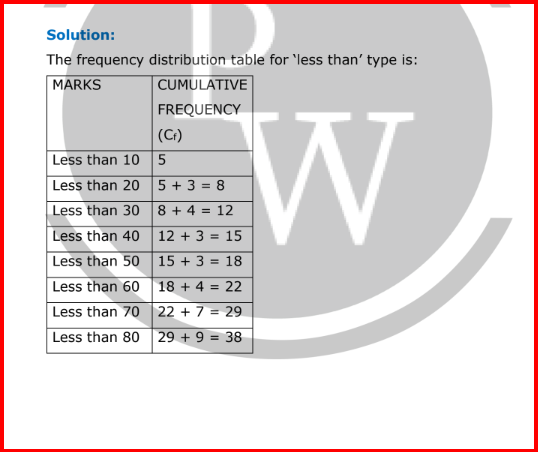
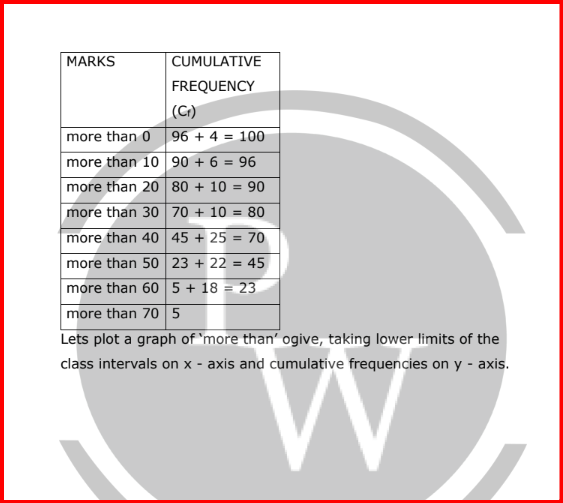
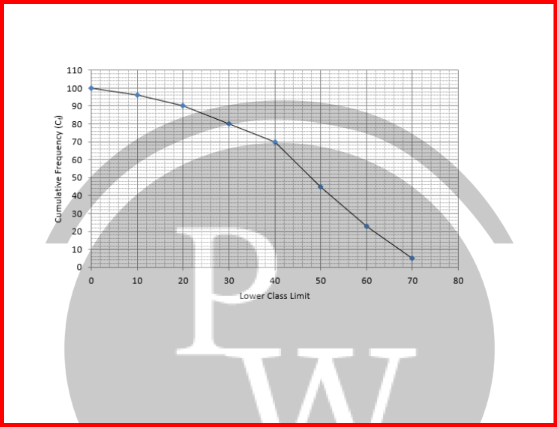
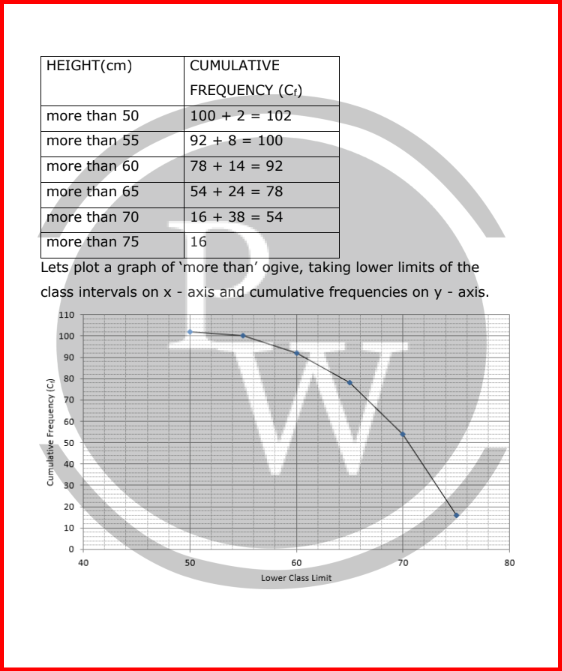
 The frequency distribution table for ‘more than’ type is:
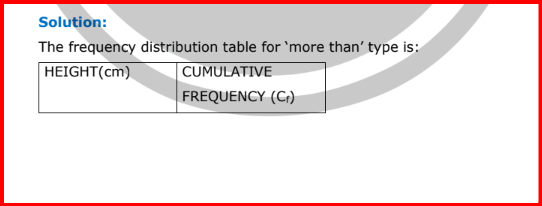
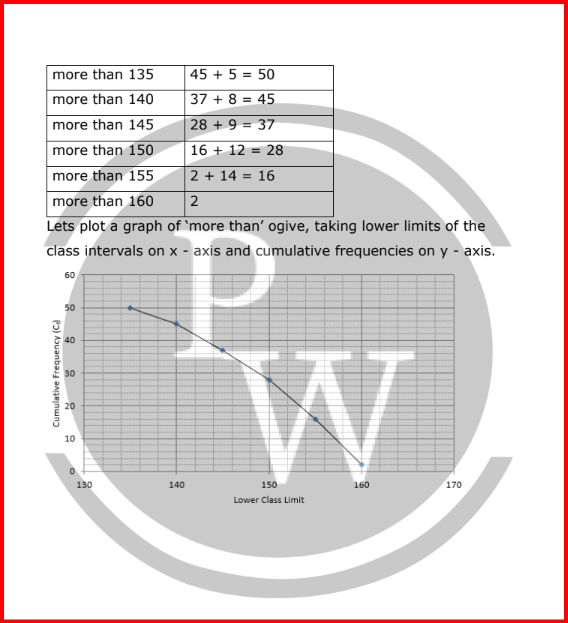
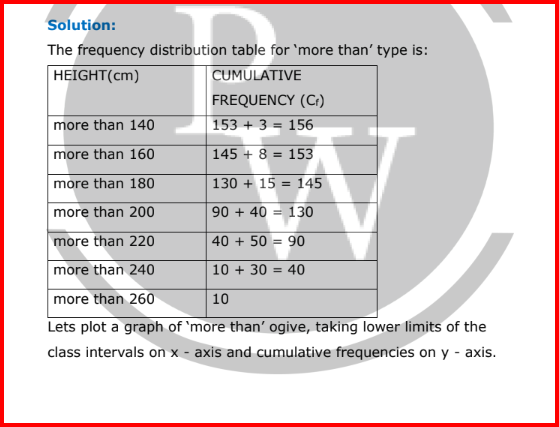
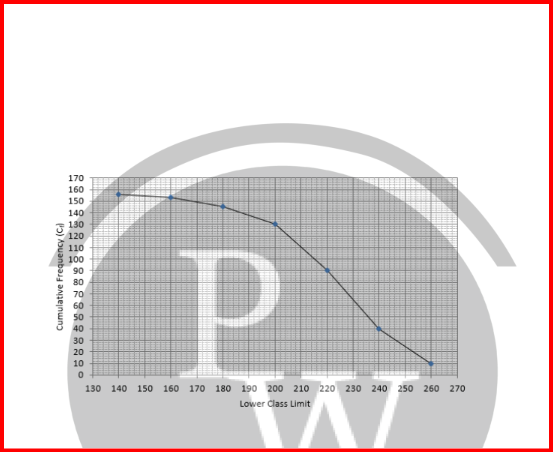
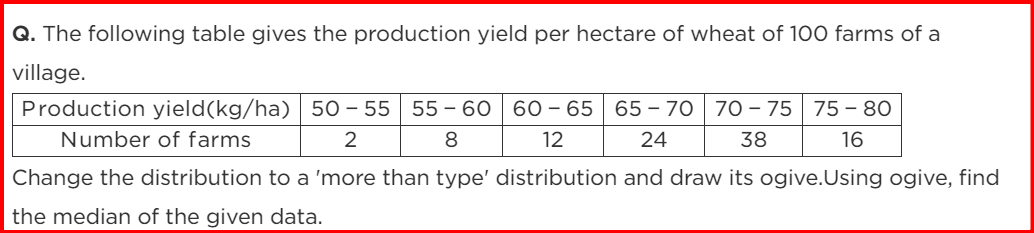 The frequency distribution table for ‘more than’ type is:
Benefits of RS Aggarwal Solutions for Class 10 Maths Chapter 9 Exercise 9.4
- Clear Explanations: The solutions provide clear explanations and step-by-step methods for constructing histograms, making it easier for students to understand and apply the concepts.
- Graphical Representation Skills: Students learn how to effectively present data using histograms, improving their ability to interpret and analyze data visually.
- Practical Application: By practicing these solutions, students develop practical skills in creating and interpreting histograms, which are important in various fields requiring data analysis.
- Conceptual Clarity: Students gain a deeper understanding of how histograms visually represent data distribution, aiding in their overall comprehension of statistical concepts.
- Expert Guidance: Prepared by subject experts at Physics Wallah, these solutions ensure accuracy and reliability, providing students with reliable guidance in learning and applying histogram techniques.
RS Aggarwal Solutions for Class 10 Maths Chapter 9 Exercise 9.4 FAQs
What is a histogram?
A histogram is a graphical representation of data that uses bars to show the frequency of data within intervals (bins).
How do you construct a histogram?
To construct a histogram, first, determine the number of intervals (bins) and their widths. Then, count the frequencies of data points falling into each interval and draw bars of corresponding heights for each interval on a graph.
What does the height of each bar in a histogram represent?
The height of each bar in a histogram represents the frequency or number of data points falling within each interval (bin).
What are histograms used for?
Histograms are used to visually represent the distribution of data and show patterns, trends, and outliers within the data set. They are commonly used in statistics, research, and various fields to analyze and interpret data.


🔥 Trending Blogs
Talk to a counsellorHave doubts? Our support team will be happy to assist you!

Check out these Related Articles
Join 15 Million students on the app today!

Free Learning Resources
PW Books
Notes (Class 10-12)
PW Study Materials
Notes (Class 6-9)
Ncert Solutions
Govt Exams
Our Other Websites
Class 6th to 12th Online Courses
Govt Job Exams Courses
UPSC Coaching
Defence Exam Coaching
Gate Exam Coaching
Other Exams
Know about Physics Wallah
Physics Wallah is an Indian edtech platform that provides accessible & comprehensive learning experiences to students from Class 6th to postgraduate level. We also provide extensive NCERT solutions, sample paper, NEET, JEE Mains, BITSAT previous year papers & more such resources to students. Physics Wallah also caters to over 3.5 million registered students and over 78 lakh+ Youtube subscribers with 4.8 rating on its app.
We Stand Out because
We provide students with intensive courses with India’s qualified & experienced faculties & mentors. PW strives to make the learning experience comprehensive and accessible for students of all sections of society. We believe in empowering every single student who couldn't dream of a good career in engineering and medical field earlier.
Our Key Focus Areas
Physics Wallah's main focus is to make the learning experience as economical as possible for all students. With our affordable courses like Lakshya, Udaan and Arjuna and many others, we have been able to provide a platform for lakhs of aspirants. From providing Chemistry, Maths, Physics formula to giving e-books of eminent authors like RD Sharma, RS Aggarwal and Lakhmir Singh, PW focuses on every single student's need for preparation.
What Makes Us Different
Physics Wallah strives to develop a comprehensive pedagogical structure for students, where they get a state-of-the-art learning experience with study material and resources. Apart from catering students preparing for JEE Mains and NEET, PW also provides study material for each state board like Uttar Pradesh, Bihar, and others
Copyright © 2026 Physicswallah Limited All rights reserved.