
Measures of Central Tendency, Meaning and Objectives
Measures of central tendency, often referred to as averages, are statistical tools used to describe the central or typical value of a dataset. Check out the article to know more of Mean, Median, Mode
Measures of central tendency are fundamental concepts in statistics. They provide valuable insights into the typical or central values within a dataset. As a statistical measure, central tendency summarises data distribution by identifying a representative value that best represents the entire set.
This article explores the Measures of Central Tendency concept, examining the various methods used to calculate it and its significance in statistical analysis. Understanding central tendency is essential for researchers, analysts, and decision-makers across various fields, as it enables them to gain a deeper understanding of datasets and draw meaningful conclusions from the information they containWhat Is the Measures of Central Tendency?
Measures of central tendency are statistical metrics that summarise data by identifying the central point or typical value within the dataset. These measures provide a single value representing the data distribution's middle or centre. Common measures of central tendency include the mean (average), median (middle value), and mode (most frequently occurring value). These metrics are essential in statistics as they provide a simple and informative data summary, helping to understand the overall pattern and distribution.Mean (Arithmetic Mean)?
The mean, also known as the average, is the most popular and widely recognised measure of central tendency. It can be applied to discrete and continuous data, though it is most commonly used with continuous data. In school, we have to understand the basics of calculating the average. However, at higher levels of education, we know more about the concept of the mean. In statistics, there are three main types of mean values:- Arithmetic Mean
- Geometric Mean
- Harmonic Mean
Mean = (Sum of all the observations/Total number of observations)
Median
The median of a data set is the middle value when the data is arranged in ascending order. One advantage of using the median as a measure of central tendency is that it is less affected by outliers and skewed data. The median can be determined for both ungrouped and grouped data.Ungrouped Data
For ungrouped data, the median is calculated differently based on whether the number of data values is odd or even:Odd Number of Values (n=odd): Median=(𝑛+1/2)th observation
Even Number of Values (n=even):Median=(𝑛2)th observation+(𝑛2+1)th observation/2
Grouped Data
For grouped data, the median is calculated using the following formula:Median=𝑙+(𝑛2−𝑐𝑓𝑓)×ℎ
Where:- 𝑙 is the lower limit of the median class,
- 𝑓 is the frequency of the median class,
- ℎ is the width of the median class,
- 𝑐𝑓 is the cumulative frequency of the class preceding the median class.
Mode
The mode is the value in a data set that appears most frequently—that is, it is the observation with the highest frequency. The mode is the most common value in a data set, while the range is the difference between the highest and lowest values. There are different types of modes, depending on the number of times the most frequent value appears:- Unimodal : A set with one mode.
- Bimodal : A set with two modes.
- Trimodal : A set with three modes.
- Multimodal : A set with four or more modes.
Mode = L + (f 1– f 0/2f 1– f 0– f 2 )*h.
- l=lower limit of modal class
- fm=frequency of modal class
- f1=frequency of class preceding modal class
- f2=frequency of class succeeding modal class and h=class width.
| Also Read | |
| Capital investment process | Elasticity and Expenditure |
| Market Supply Curve: Definition, How It Works, and Example | How to Calculate Variable Cost? Formula, Definition, Example |
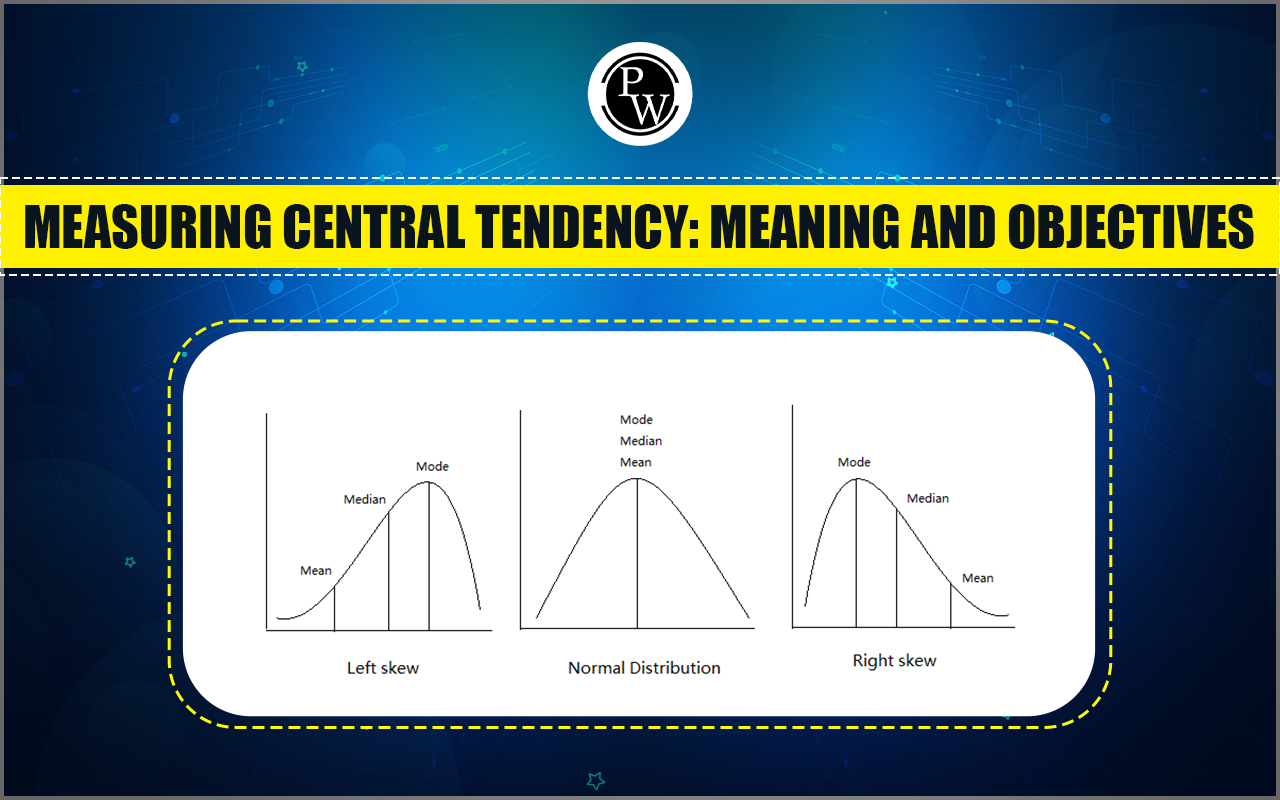
Distribution of Central Tendency
The distribution of central tendency refers to the pattern or arrangement of the central values within a dataset. The measures of central tendency are the mean, median, and mode. It provides insight into where most data points cluster and how they are distributed around a typical value. Understanding the distribution of central tendency helps analysts and researchers interpret the dataset's characteristics, including its symmetry, skewness, or multimodality. A dataset distribution is a collection of n number of observations, broadly classified into: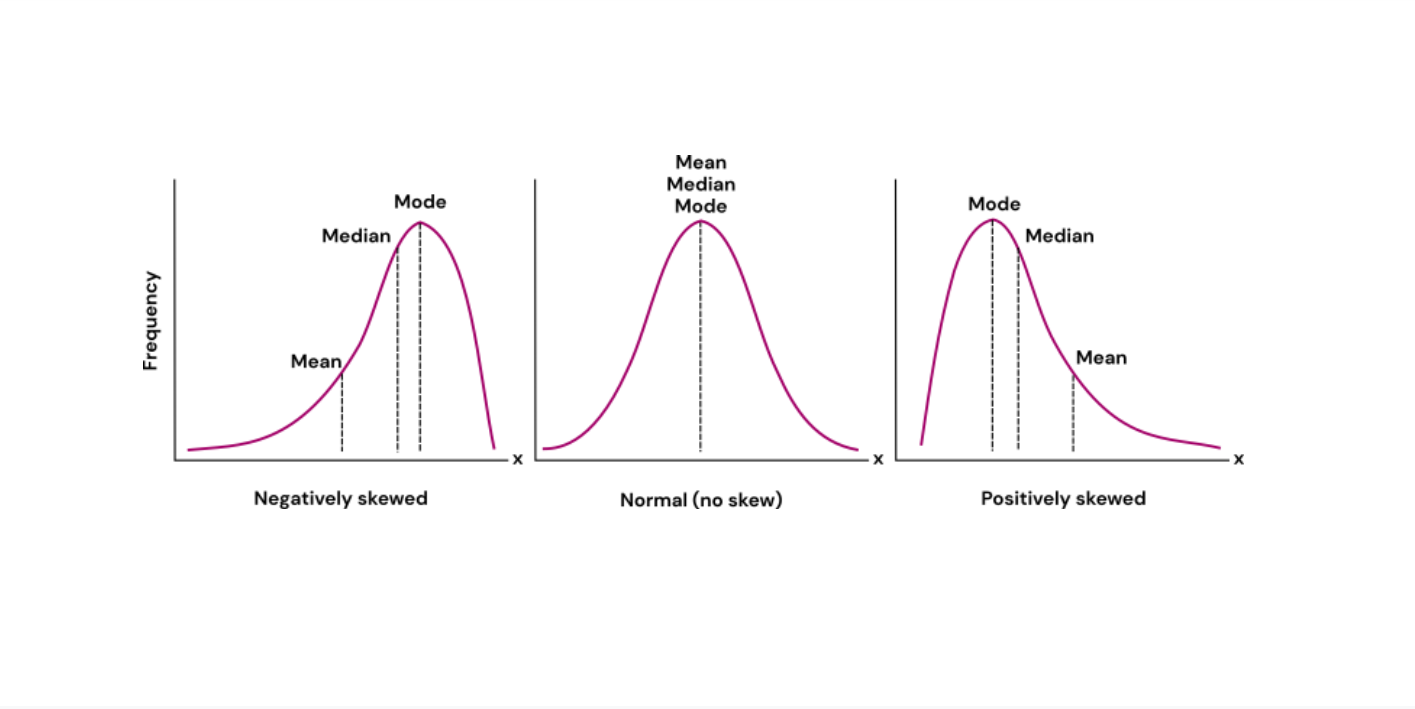
- Normal Distribution :
Mean = Median = Mode
- Skewed Distribution :
- Right Skew:
Mean > Median > Mode
- Left Skew:
Mean < Median < Mode
The objective of Measures of Central Tendency
Measures of Central Tendency aim to identify a single value that best represents a dataset's centre or typical value. This measure provides a concise data summary, allowing for easier comparison and interpretation. Here are the key purposes of measuring central tendency: Summarising Data : Measures of central tendency concisely summarise a dataset's central or typical value. This allows researchers, analysts, and decision-makers to understand the overall characteristics of the data quickly. Identifying Typical Values : These measures indicate the most common or representative values in the dataset, helping to identify typical observations, patterns, and trends. Facilitating Comparison : Measures of Central Tendency help compare different datasets or subsets of data by providing a common reference point. This helps assess similarities, differences, and variations in central values across various groups or periods. Supporting Decision-Making : These measures assist decision-making processes by providing insights into the central value around which data tends to cluster. This information is valuable for setting benchmarks, establishing targets, and making informed judgments. Assessing Distribution : The measures of central tendency offer indications of the data's distributional characteristics, such as symmetry, skewness, or multimodality. They complement measures of dispersion by providing context for understanding the spread of data around the central value. Detecting Outliers : Central tendency measures help identify outliers or extreme values that may significantly influence the data's overall distribution by highlighting the central or typical value within the dataset. Interpreting Statistical Analyses : Central tendency measures are essential components of statistical analyses. They aid in interpreting data results, hypothesis testing, and drawing meaningful conclusions from research findings. Communicating Results : These Measures of Central Tendency clearly and concisely communicate the central value of the data to diverse audiences, including stakeholders, policymakers, and the general public, facilitating the understanding and interpretation of statistical information.
Begin your journey towards academic excellence in Commerce with our comprehensive
Class 11 Commerce courses
. Master the CBSE syllabus with expert guidance and ace your exams. Enroll now!”
Measures of Central Tendency FAQs
What are the main measures of central tendency?
The main measures of central tendency are mean, median, mode, and midrange.
What is the median?
The median is the middle value of a dataset when arranged in ascending or descending order. If there's an odd number of observations, it's the middle value. If there's an even number, it's the average of the two middle values.
How is the mode formula interpreted?
The mode formula considers the frequency distribution of the dataset, allowing us to calculate the modal value based on the frequencies of the modal class and its neighbouring classes.
🔥 Trending Blogs
Talk to a counsellorHave doubts? Our support team will be happy to assist you!

Check out these Related Articles


Join 15 Million students on the app today!

Free Learning Resources
PW Books
Notes (Class 10-12)
PW Study Materials
Notes (Class 6-9)
Ncert Solutions
Govt Exams
Our Other Websites
Class 6th to 12th Online Courses
Govt Job Exams Courses
UPSC Coaching
Defence Exam Coaching
Gate Exam Coaching
Other Exams
Know about Physics Wallah
Physics Wallah is an Indian edtech platform that provides accessible & comprehensive learning experiences to students from Class 6th to postgraduate level. We also provide extensive NCERT solutions, sample paper, NEET, JEE Mains, BITSAT previous year papers & more such resources to students. Physics Wallah also caters to over 3.5 million registered students and over 78 lakh+ Youtube subscribers with 4.8 rating on its app.
We Stand Out because
We provide students with intensive courses with India’s qualified & experienced faculties & mentors. PW strives to make the learning experience comprehensive and accessible for students of all sections of society. We believe in empowering every single student who couldn't dream of a good career in engineering and medical field earlier.
Our Key Focus Areas
Physics Wallah's main focus is to make the learning experience as economical as possible for all students. With our affordable courses like Lakshya, Udaan and Arjuna and many others, we have been able to provide a platform for lakhs of aspirants. From providing Chemistry, Maths, Physics formula to giving e-books of eminent authors like RD Sharma, RS Aggarwal and Lakhmir Singh, PW focuses on every single student's need for preparation.
What Makes Us Different
Physics Wallah strives to develop a comprehensive pedagogical structure for students, where they get a state-of-the-art learning experience with study material and resources. Apart from catering students preparing for JEE Mains and NEET, PW also provides study material for each state board like Uttar Pradesh, Bihar, and others
Copyright © 2026 Physicswallah Limited All rights reserved.