Financial Statement Analysis: Basics, Ratios, and Interpretation
Here are the essentials of financial statement analysis, including key characteristics of good financial statements, the importance of ratio analysis, and guidelines for interpreting financial data.
What is Financial Statement Analysis?
Financial statement analysis is a critical skill for investors, managers, and other stakeholders. It involves evaluating the financial health and performance of a company through its financial statements—primarily the balance sheet, income statement, and cash flow statement. By interpreting these statements, stakeholders can make informed decisions about investments, management strategies, and financial planning.Characteristics of Good Financial Statements and Their Relevance for Better Reporting
Understandability The information in the financial statements must be easy for users to understand. This means it should be clearly presented, with extra details provided in the footnotes if needed to make things clearer. Relevance The information must be useful to the users, meaning it should help them make economic decisions. This includes reporting important details or information that, if left out or incorrect, could affect their decisions. Reliability The information must be accurate, unbiased, and not misleading. It should truthfully show transactions and events, reflect their true nature, and carefully present estimates and uncertainties with proper explanations. Comparability The information must be comparable to financial information from other periods, so users can spot trends in the company's performance and financial position.Usage And Features Of Ratio Analysis
Comparisons Ratio analysis can be utilized to assess a company's financial performance by comparing it with that of other companies within the same industry, providing insights into its market position. By getting financial ratios, like Price/Earnings, from competitors and comparing them to the company's ratios, management can identify market gaps and examine its competitive advantages, strengths, and weaknesses. Management can then use this information to make decisions that aim to improve the company's market position. Trend line Companies can also use ratios to spot trends in financial performance. Established companies gather data from financial statements over many periods. This trend can help predict future financial performance and identify potential financial problems that wouldn't be visible from ratios of a single period. Operational efficiency Company management can use financial ratio analysis to measure how efficiently assets and liabilities are managed. Inefficient use of assets like vehicles, land, and buildings leads to unnecessary expenses that should be cut. Financial ratios can also indicate whether financial resources are being overutilized or underutilized.Financial Ratios
A ratio represents an arithmetic relationship between two numbers. Financial ratio analysis involves examining the ratios between different items or groups of items in financial statements. These financial ratios can be categorized in various ways. For our purposes, we classify them into four broad categories as follows:- Liquidity Ratios
- Leverage / Solvency Ratios
- Turnover Ratios
- Profitability Ratios
Liquidity Ratios
Current Ratio: Current Assets/ Current liabilities Current assets consist of cash, current investments, debtors, inventories (stocks), loans and advances, and prepaid expenses. Current liabilities refer to obligations expected to be settled within the next twelve months, including (i) secured or unsecured loans due within the next year and (ii) current liabilities and provisions. Acid-test Ratio / Quick / Liquid Ratio: Current Assets − Inventories/ Current liabilities Quick assets are defined as current assets excluding inventories and other current assets such as prepaid expenses, advance tax, etc. This is a relatively strict measure of liquidity since it omits inventories, which are often the least liquid among current assets, from the numerator. Cash Ratio Sometimes, financial analysts look at cash ratio, which is defined as: Cash and bank balances + Current investments/ Current liabilitiesLeverage / Solvency Ratios
Debt-equity Ratio: Long Term Debts/ Shareholders’ Funds Shareholders’ Funds (Equity) = Share capital + Reserves and Surplus + Money received against share warrants + Share application money pending allotment Share Capital = Equity share capital + Preference share capital OR Shareholders’ Funds (Equity) = Non-current Assets + Working capital – non-current liabilities Working Capital = Current Assets – Current Liabilities Debt to Capital Employed Ratio: Long−term Debt/ Capital Employed (or Net Assets) Capital employed = long-term debt + shareholders’ funds. Alternatively, it may be taken as net assets = total assets – current liabilities Interest Coverage Ratio: Profit before interest and taxes/ Interest on Long term debts OR Profit before interest and taxes + Depreciation/ Debt interest Profit before interest and tax = Profit before tax + Interest Profit before tax = Profit after tax × 100/ 100−Tax rate Fixed Charges Coverage Ratio: Profit before interest and taxes + Depreciation/ Repayment of loan Interest + (1 – Tax rate) Debt Service Coverage Ratio: Profit after tax +Depreciation +Other non−cash charges Interest on term loan + Lease rentals/ Interest on term loan + Lease rentals + Repayment of term loanTurnover Ratios
Inventory Turnover: Cost of goods sold/ Average inventory Cost of Goods Sold = Inventory in the beginning + Net Purchases + Wages + Carriage inwards – Inventory at the end Cost of Goods Sold = (Inventory in the beginning + Inventory at the end)/ 2 Debtors’ Turnover: This ratio shows how many times sundry debtors (accounts receivable) turn over during the year. It is defined as: Net credit sales/ Average sundry debtors If the figure for net credit sales is not available, one may have to make do with the net sales figure. Clearly, the higher the debtors' turnover, the more efficient the credit management. Average Collection Period The average collection period represents the number of days’ worth of credit sales that is locked in sundry debtors. It is defined as: Average sundry debtors/ Average daily credit sales Note that the average collection period and the debtors’ turnover are related as follows: Average collection period = 365/ Debtors’ turnover Net credit sales = Total sales – Cash sales Average sundry debtors = Opening debtors+Closing debtors/ 2 Fixed Assets Turnover: Net sales/ Average net fixed assets Total Assets Turnover: Net sales/ Average total assetsProfitability Ratios
Gross Profit Margin: Gross Profit = Revenue from Operations – Cost of Revenue from Operation Revenue from Operations = Cash Revenue from Operations + Credit Revenue from Operation Cost of Revenue from operation = Purchases + (Opening Inventory – Closing Inventory) + Direct Expenses EBITDA Margin: Earnings before interest, taxes, depreciation, and amortization/ Net sales Net Profit Margin: Net profit/ Net sales x 100 Net profit = Gross profit - Indirect expenses Return on Assets: Profit after tax/ Average total assets Earning Power: Profit before interest and tax/ Average total assets Return on Capital Employed: Profit before interest and tax (1 − Tax rate)/ Average total assets Return on Equity: Equity earnings/ Average equityDuPont Analysis
DuPont analysis is a method used to break down the components of the Return on Equity (ROE). It decomposes ROE into three parts: profit margin, asset turnover, and financial leverage. The formula is: Return on Equity = Net Profit Margin × Asset Turnover Ratio × Financial Leverage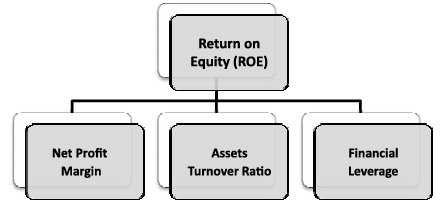
- Net Profit Margin = ( Net Profit/ Sales ) - The Net Profit Margin signifies the Profit that is extracted per rupee of Sales. Everything else remains the same, a company which has a higher Net Profit Margin has a higher ROE.
- Asset Turnover Ratio = ( Sales/ Total Assets ) - This ratio is an efficiency measurement used to determine how effectively a company uses its assets to generate revenue. The higher the asset turnover ratio, the higher the ROE, assuming all other factors remain constant.
- Financial Leverage = ( Total Assets/ Total Equity ) - Financial Leverage measures whether a company finances the purchase of assets primarily through debt or equity. The higher the Financial Leverage the higher the ROE. When financial leverage becomes excessive, it can increase the risk of bankruptcy.
Reading And Interpretation Of Financial Statement
- Balance sheet
- Profit and loss Statement
- Cash-flow statement
- Analysis of Auditor's Report and Opinion
- Auditor’s Opinion
- Analysis of Management Judgement
Problems in Financial Statement Analysis
- Lack of an Underlying Theory
- Conglomerate Firms
- Window Dressing
- Price Level Changes
- Variations in Accounting Policies
- Interpretation of Results
- Correlation among Ratios
Guidelines for Financial Statement Analysis
- Use ratios to get clues to ask the right questions
- Be selective in the choice of ratios
- Employ proper benchmarks
- Know the tricks used by accountants
- Read the footnotes: Footnotes sometimes contain valuable information
- Keep in mind that financial statement analysis is a unique blend of art and science.
| Also Check: | |
| Introduction to Accounting | Capital Structure |
| Introduction to Accounting Standards | Introduction to Corporate Accounting |
| Capital Budgeting | Security Analysis |
Financial Statement Analysis <span style=
What is financial statement analysis?
Financial statement analysis involves evaluating a company's financial health by examining its balance sheet, income statement, and cash flow statement. It helps stakeholders understand the company's performance and make informed decisions.
Why is financial statement analysis important?
It is crucial because it provides insights into a company's profitability, liquidity, solvency, and overall financial performance, which are essential for investors, creditors, and managers in making informed decisions.
What are financial ratios, and how are they used?
Financial ratios are mathematical tools used to analyze relationships between different items in financial statements. They help assess a company's efficiency, profitability, liquidity, and leverage compared to industry standards or competitors.
What are the key characteristics of good financial statements?
Good financial statements are characterized by clarity (understandability), relevance (usefulness for decision-making), accuracy (reliability), and consistency (comparability with previous periods).
How does financial statement analysis help in decision-making?
It helps stakeholders identify trends, strengths, and weaknesses in a company's financial performance. This analysis guides investment decisions, strategic planning, and operational improvements.
🔥 Trending Blogs
Talk to a counsellorHave doubts? Our support team will be happy to assist you!

Join 15 Million students on the app today!

Free Learning Resources
PW Books
Notes (Class 10-12)
PW Study Materials
Notes (Class 6-9)
Ncert Solutions
Govt Exams
Our Other Websites
Class 6th to 12th Online Courses
Govt Job Exams Courses
UPSC Coaching
Defence Exam Coaching
Gate Exam Coaching
Other Exams
Know about Physics Wallah
Physics Wallah is an Indian edtech platform that provides accessible & comprehensive learning experiences to students from Class 6th to postgraduate level. We also provide extensive NCERT solutions, sample paper, NEET, JEE Mains, BITSAT previous year papers & more such resources to students. Physics Wallah also caters to over 3.5 million registered students and over 78 lakh+ Youtube subscribers with 4.8 rating on its app.
We Stand Out because
We provide students with intensive courses with India’s qualified & experienced faculties & mentors. PW strives to make the learning experience comprehensive and accessible for students of all sections of society. We believe in empowering every single student who couldn't dream of a good career in engineering and medical field earlier.
Our Key Focus Areas
Physics Wallah's main focus is to make the learning experience as economical as possible for all students. With our affordable courses like Lakshya, Udaan and Arjuna and many others, we have been able to provide a platform for lakhs of aspirants. From providing Chemistry, Maths, Physics formula to giving e-books of eminent authors like RD Sharma, RS Aggarwal and Lakhmir Singh, PW focuses on every single student's need for preparation.
What Makes Us Different
Physics Wallah strives to develop a comprehensive pedagogical structure for students, where they get a state-of-the-art learning experience with study material and resources. Apart from catering students preparing for JEE Mains and NEET, PW also provides study material for each state board like Uttar Pradesh, Bihar, and others
Copyright © 2026 Physicswallah Limited All rights reserved.