Graphs In Motion In One Dimension, Types Of Graphs, Important Topics For JEE 2025

Graphs In Motion In One Dimension : A variety of events occur around us. We use equations and derivatives to have a better understanding of it. To have an idea at a glance, we use graphs. Using graph, we can deduct the relation between two physical quantities.
Graphs In Motion In One Dimension
In order to describe a physical event, we use graphs. A pictorial representation of data is called graphs. In graphs, we will have two axes – one is the independent variable, and the other is the dependent variable. As we name the two axes as x-axis and y-axis, we generally choose the x-axis for the independent variable and the y-axis for the dependent variable. We draw the information from the graph by finding the slope of the graph and finding the area between the curve and the x-axis. We find the slope by taking the ratio of change in the dependent variable to that of the independent variable.Motion In One Dimension : Distance – Time Graph
In a graph, if the distance covered by the object is depicted on the y-axis according to the time on the x-axis, we can call the graph a distance-time graph. The slope of a distance-time graph gives us the speed of the object at each moment. The graph will be different for uniform motion and non-uniform motion. For uniform motion, the graph will be a straight line. For a non-uniform motion, the complete graph won’t be a straight line as the slope is not the same throughout the motion.
The distance-time graph for a uniform motion is given below.


Motion In One Dimension : Displacement, Time Graph
As we know displacement is the change in the position of an object, the physical quantity occupies the y-axis while time is on the x-axis of a displacement-time graph. Another name for the displacement-time graph is the position-time graph. For uniform motion, the position-time graph will be a straight line. For a stationary object, the position-time graph will be a straight line parallel to the x-axis. The slope of the position-time graph gives the value of velocity. A positive value for the slope indicates the motion in the positive direction while a negative value for the slope indicates the motion in the negative direction and the zero slope indicates the rest of the object. Unlike the displacement-time graph, a distance-time graph can never have a negative slope.
Velocity – Time Graph
A graph in which velocity is the dependent variable and time is the independent variable is the velocity-time graph. The slope of the velocity-time graph gives the value of acceleration. A positive value for the slope indicates the positive acceleration while a negative value for the slope indicates the negative acceleration or the retardation and the zero slope indicates the uniform motion of the object. We can find the object's displacement by calculating the area under the graph.

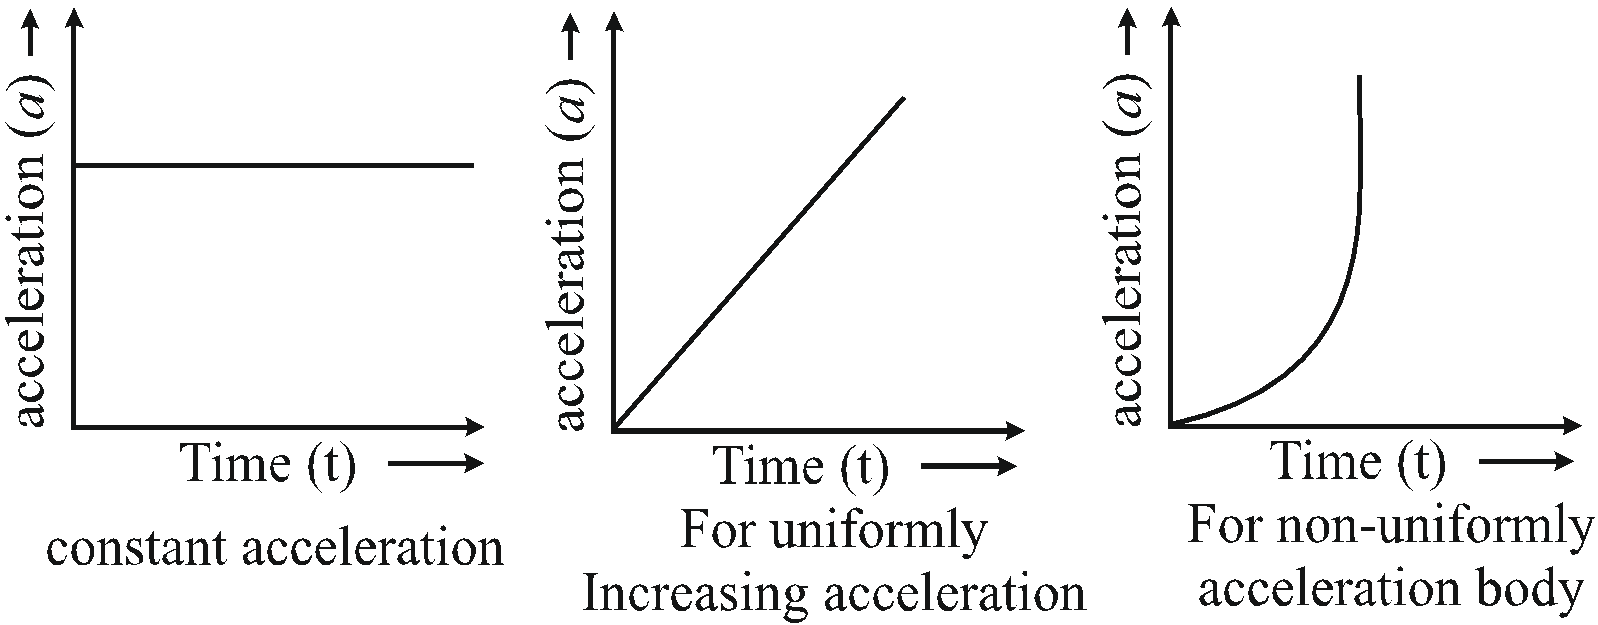
Acceleration – Time Graph
A graph in which acceleration is the dependent variable and time is the independent variable is the acceleration-time graph. The slope of the acceleration-time graph is called a jerk. A zero slope for the acceleration-time graph represents the motion of an object with constant acceleration. Different types of acceleration-time graphs are given below.
Examples Of Graphs In Motion In One Dimension
Examples 1: The displacement-time graph of a moving particle is shown. The instantaneous velocity of the particle is negative at the point.

Answer: - A negative slope in the displacement-time graph represents the negative velocity. Here, in the graph, at the point E, the slope is negative. Therefore, at E, the instantaneous velocity is negative.
Example 2: A person walks along an east-west street and a graph of his displacement from home is shown in figure. His average velocity for the whole time interval is

Answer: - Here the initial and final positions are the same. Thus, the displacement and the average velocity will be zero.
Example 3: Which of the following can not be the distance time graph
(1)

(2)

(3)

(4)

Answer: - We know that, unlike the displacement-time graph, a distance-time graph can never have a negative slope. Hence, the second graph cannot be a distance-time graph.
Study Material For IIT JEE 2025 Preparation
Prepare for IIT JEE 2025 with PW's comprehensive study material. Access expert-curated notes, practice questions, and mock tests to boost your understanding and performance in all key subjects.Graphs In Motion In One Dimension FAQs
Q.1 : What is a displacement-time graph?
Q.2: What is a velocity-time graph?
Q.3 : What is an acceleration-time graph?
Q.4: What is the slope of an acceleration-time graph?
Q.5 : Can a distance-time graph have a negative slope?