
Important Questions for Class 8 Maths Chapter 4: Chapter 4 of Class 8 Maths, Data Handling , focuses on organizing, representing, and interpreting data. Key topics include constructing bar graphs, pie charts, and histograms, understanding probability, and calculating measures of central tendency like mean, median, and mode. Important questions test skills in creating graphical representations and analyzing data to draw meaningful conclusions. Students also learn about real-life data usage and how to compare datasets effectively.
This chapter enhances critical thinking and decision-making abilities, as data handling is integral to various fields like statistics, economics, and science. It builds a strong foundation for advanced statistical concepts in higher classes.Important Questions for Class 8 Maths Chapter 4 Overview
Important Questions for Class 8 Maths Chapter 4 PDF
Chapter 4, Data Handling , in Class 8 Maths is essential for developing analytical and problem-solving skills. Important questions focus on creating bar graphs, pie charts, and histograms, and calculating mean, median, and mode. These concepts have real-world applications, helping students interpret and analyze data effectively, preparing them for advanced studies and decision-making.Important Questions for Class 8 Maths Chapter 4 PDF
Important Questions for Class 8 Maths Chapter 4 Data Handling
Below is the Important Questions for Class 8 Maths Chapter 4 Data Handling - 1. Collections of Observations are called _______Ans: Data
2. Difference between highest and lowest values of Observations in a data is called
_______ of the data.
Ans: Range
3. The number of times a particular observation occurs in a given data is called
________
Ans: Frequency
4. Define class size.
Ans: The difference between the upper limit and lower limit of a class interval is called
class size.
5. ________ is a pictorial representation of numerical data in the form of rectangle
(bars) of equal width and varying lengths.
Ans: Bar Graph
6. An operation which produce some well defined outcomes is called an _______
Ans: Random Experiment
7. Each outcome of an experiment is called ________
Ans: Trial
Short Answer Type Questions (2 Marks)
8. Define a random experiment and a trial
Ans: An experiment in which all possible outcomes are already known and the exact outcome cannot be predicted in advance is called a random experiment.
Trial means performing a random experiment.
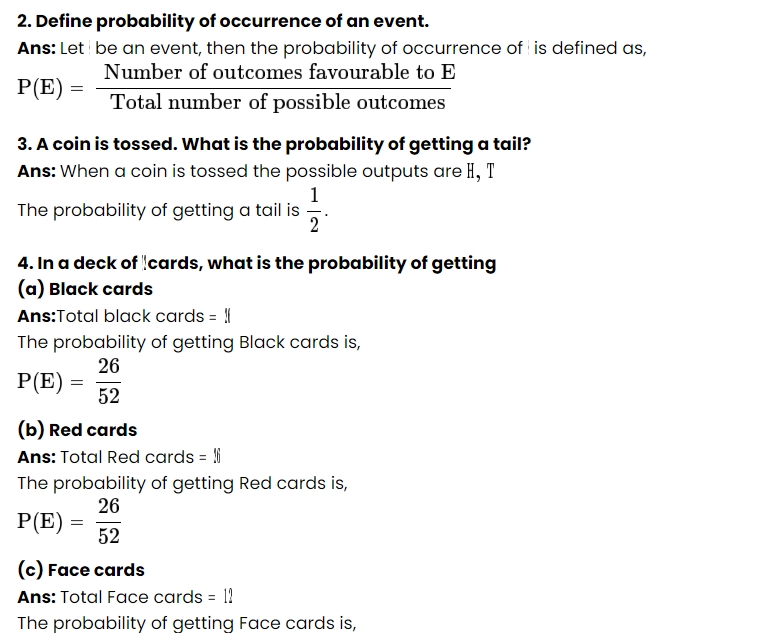
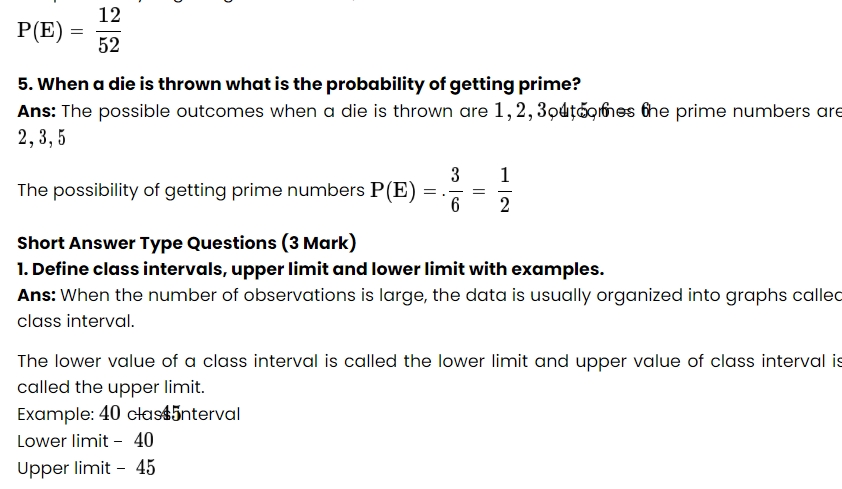
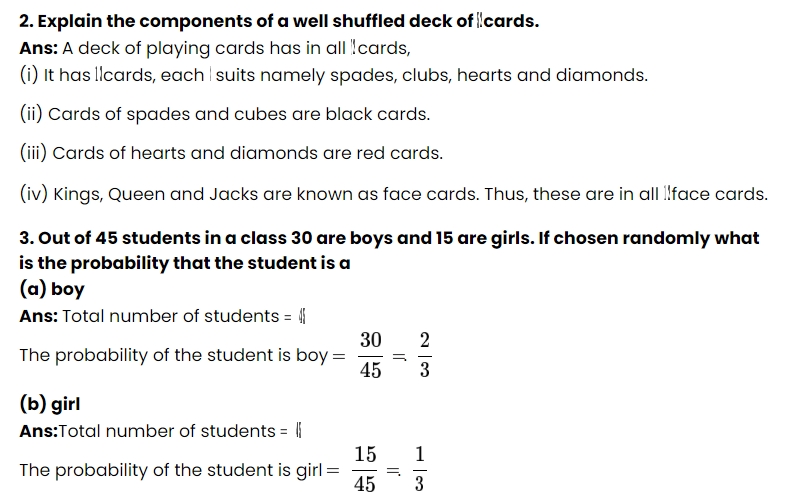
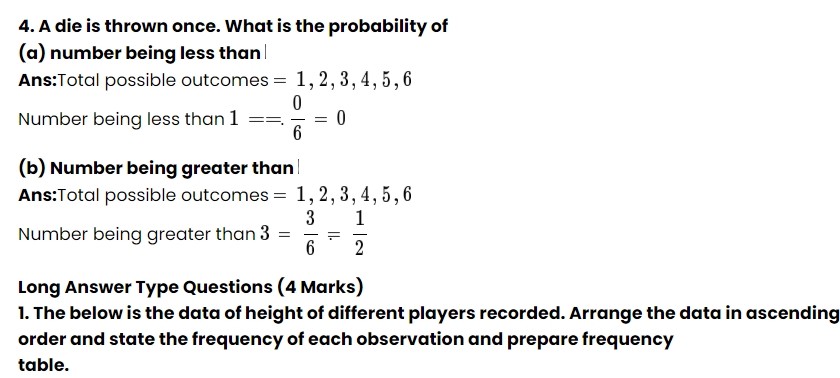
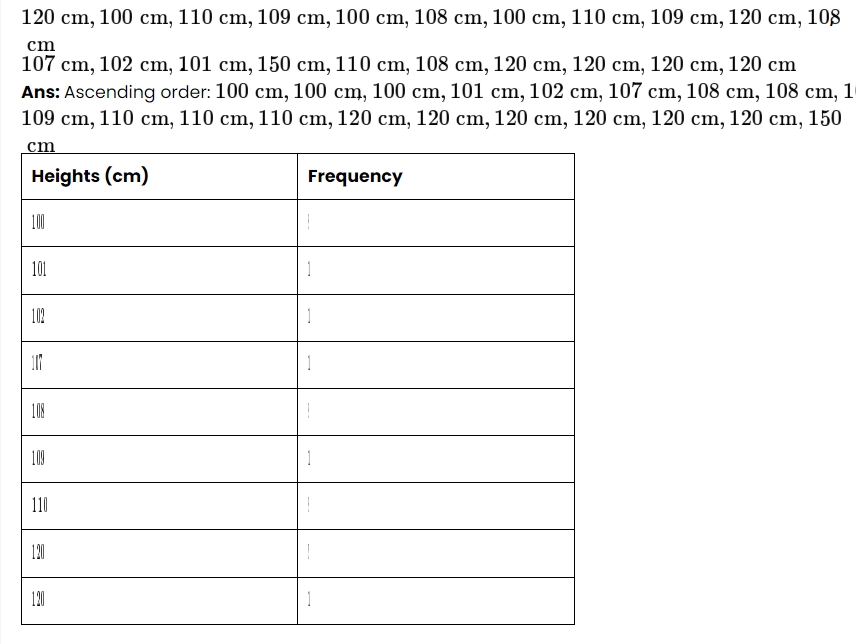
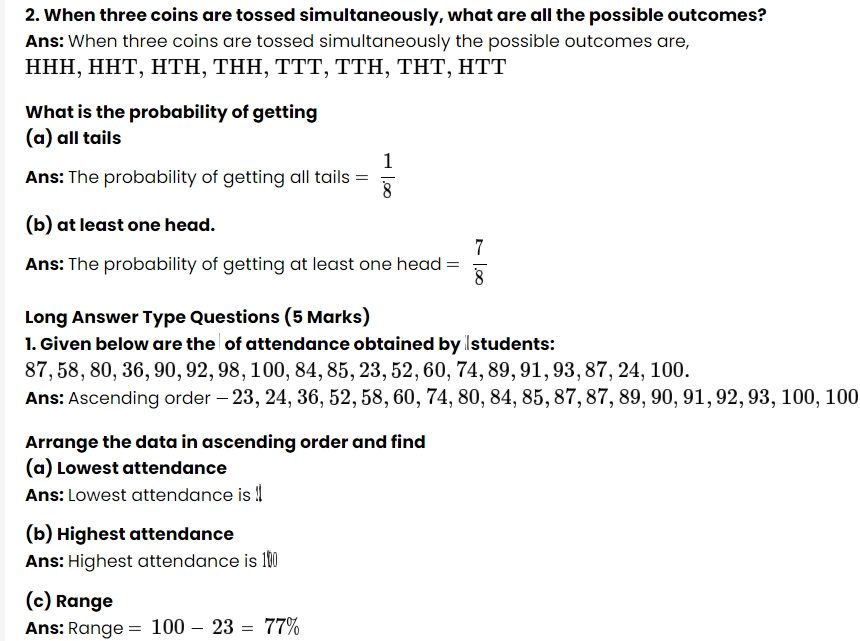
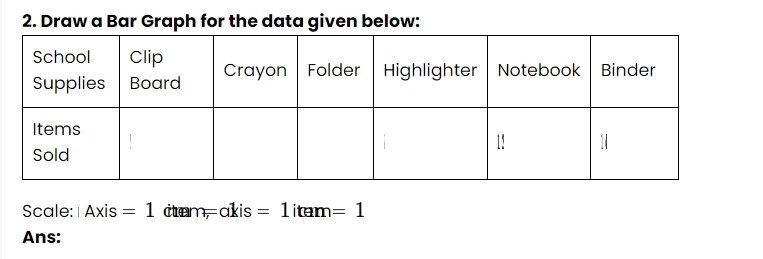

Q.3: When a die is thrown, list the outcomes of an event of getting:
(i)
(a) a prime number
(b) not a prime number
(ii)
(a) a number greater than 5
(b) a number not greater than 5.
Solution:
(i) (a) Outcomes of the event to get a prime number are 2, 3 and 5. (b) Outcomes of an event of not getting a prime number are 1, 4 and 6. (ii) (a) Outcomes of the event of getting a number greater than 5 are 6. (b) Outcomes of the event of not getting a number greater than 5 are 1, 2, 3, 4 and 5.Q.4: If you have a spinning wheel with 3 green sectors, 1 blue sector and 1 red sector, what is the probability of getting a green sector? What is the probability of getting a non-blue sector?
Solution: A total of five sectors are present. Out of the five sectors, three sectors are green. Therefore, the probability of getting a green sector = ⅗ Out of the five sectors, one sector is blue. Hence, Number of Non-blue sectors = 5 – 1 = 4 sectors Therefore, the probability of getting a non-blue sector will be equal to 4/5.Benefits of Using Important Questions for Class 8 Maths Chapter 4
Important Questions for Class 8 Maths Chapter 4 FAQs
What is the purpose of data handling?
What is the maximum in data handling?
What are the basic concepts of data handling?
How many ways can data be handled?


