

RS Aggarwal Solutions Class 9 Maths Chapter 17 Bar Graph, Histogram and Frequency Polygon
Here, we have provided RS Aggarwal Solutions Class 9 Maths Chapter 17. Students can view these RS Aggarwal Solutions Class 9 Maths Chapter 17 before exams for better understanding of the chapter.
RS Aggarwal Solutions Class 9 Maths Chapter 17
RS Aggarwal Solutions Class 9 Maths Chapter 17: Statistics and numbers are the subjects of mathematics. Math brings with it a huge number of ideas, concepts, and themes related to diplomacy. For the students to succeed in gaining that mathematician's throne, a great deal of practice and diligence are needed.
Within the framework of our contemporary educational system, mathematics is essential to defining youth prospects. Still, a few of the students fall short of scaling the complexity mountain that the subjects. To ensure that they can easily understand the concepts, formulae, and theorems, students must have a strong foundation in mathematics.RS Aggarwal Solutions Class 9 Maths Chapter 17 Bar Graph, Histogram and Frequency Polygon
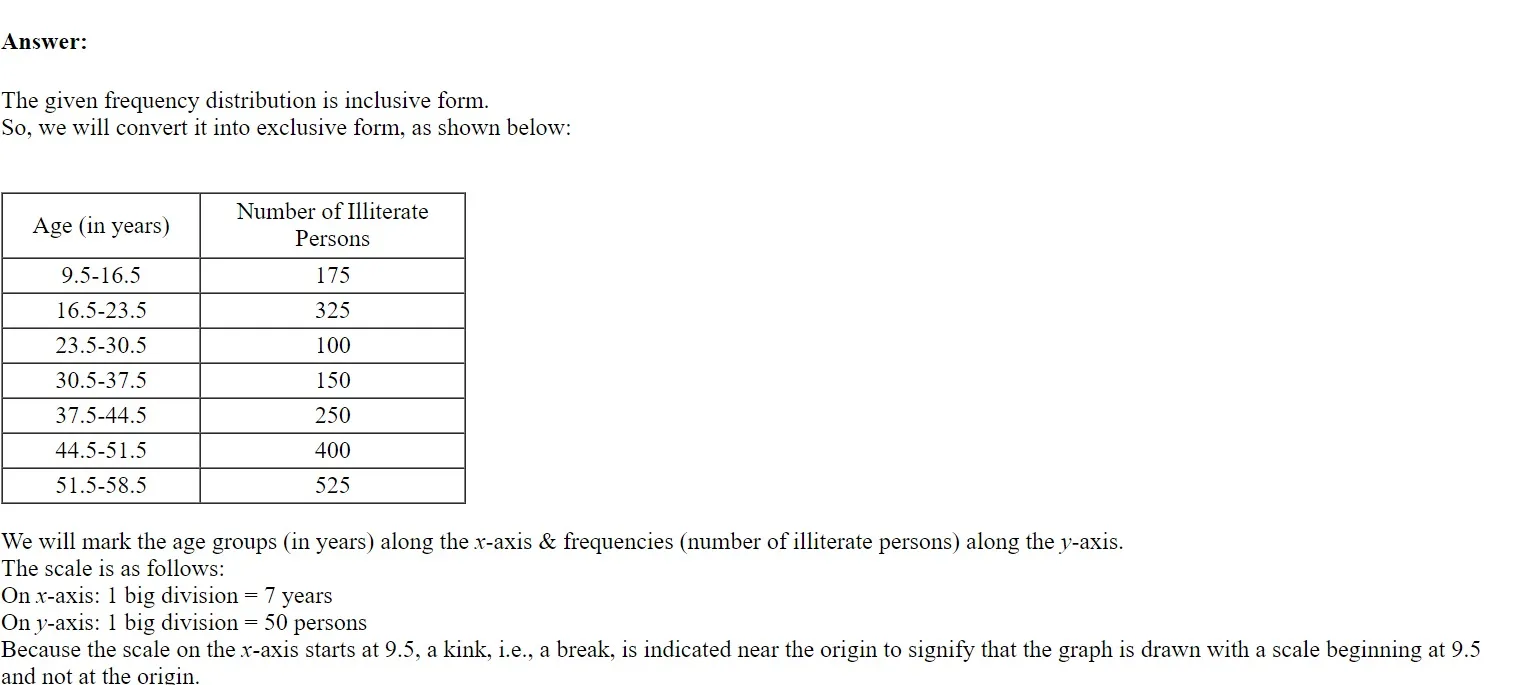
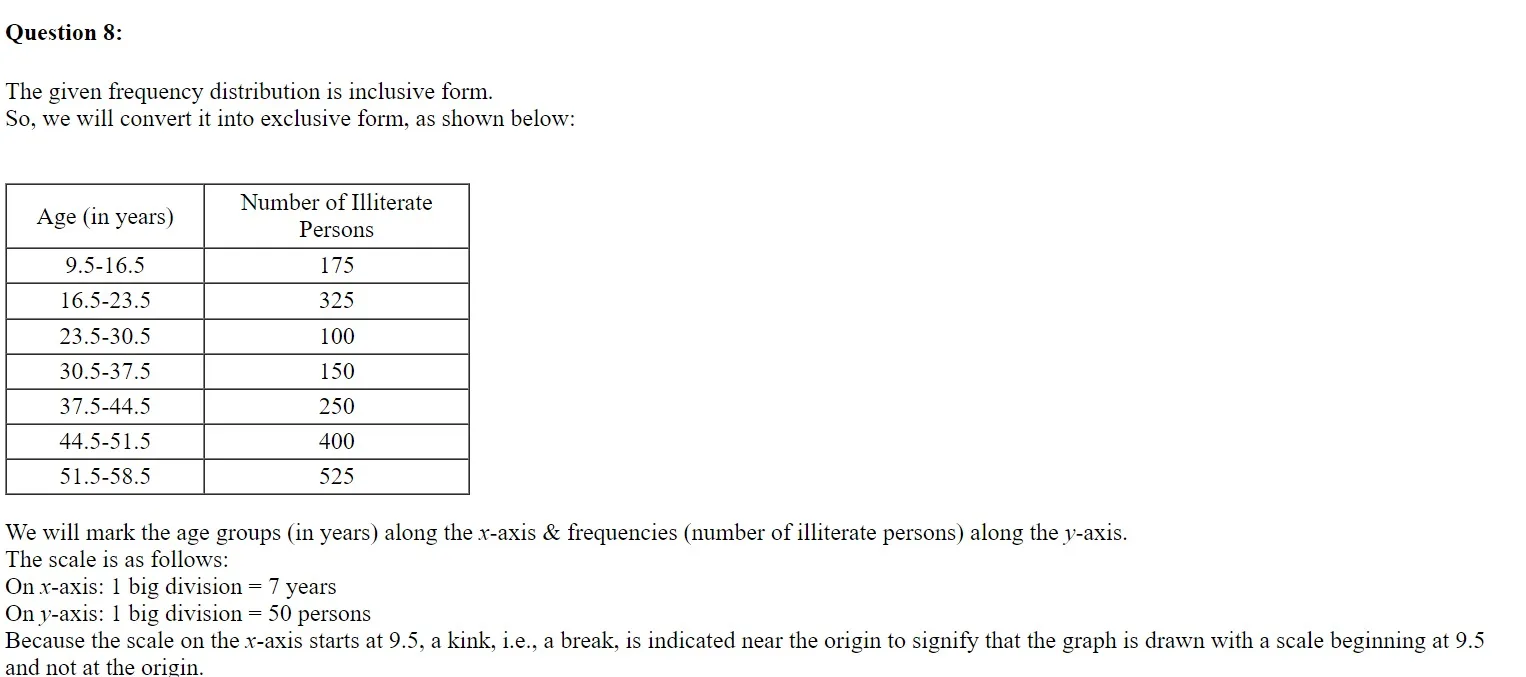
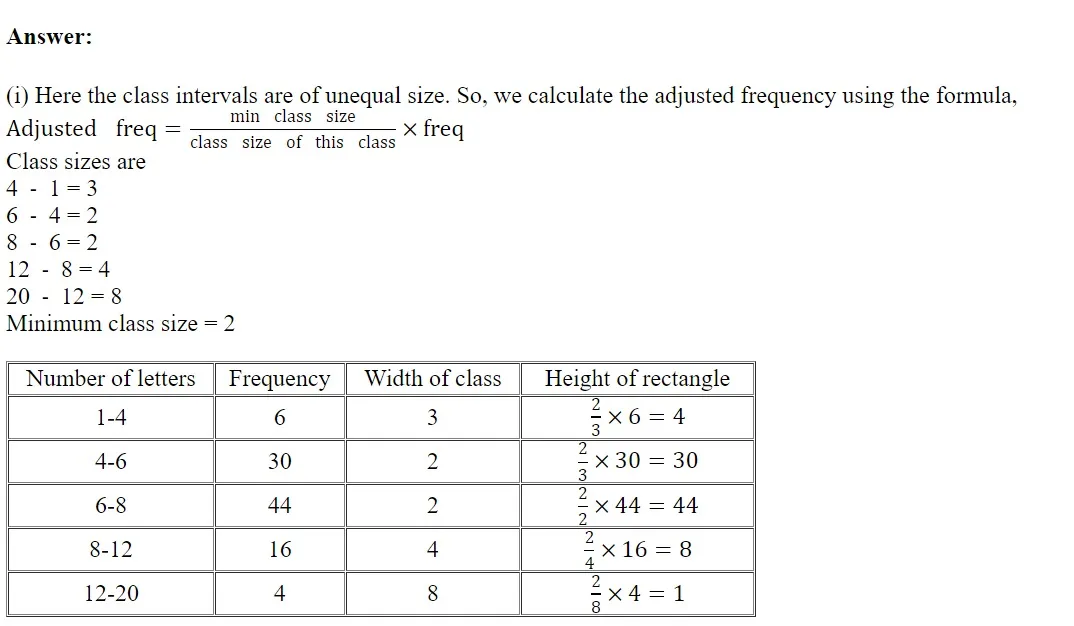
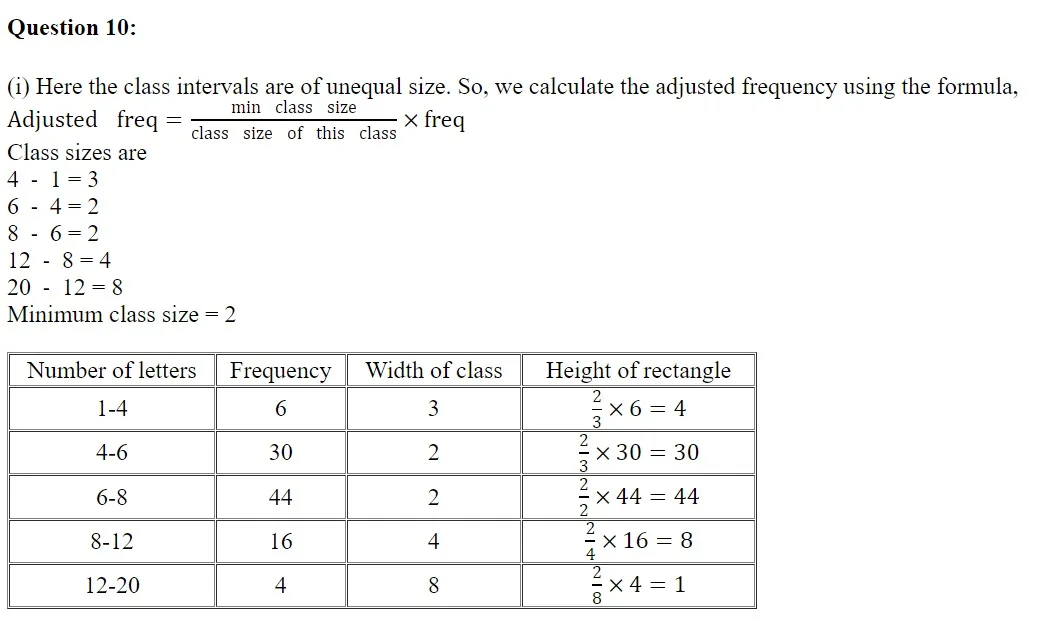
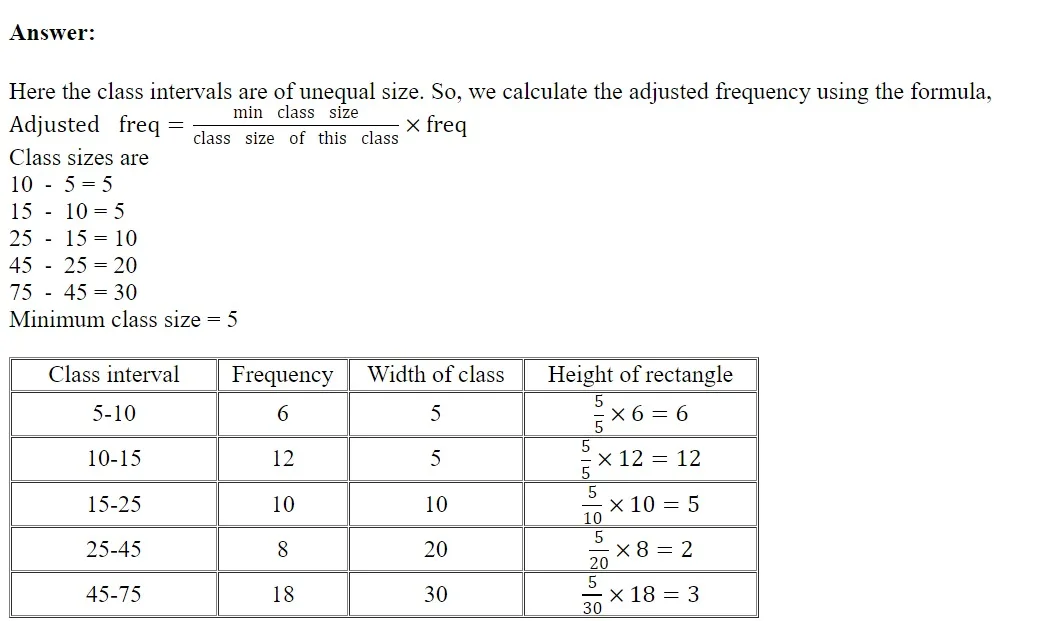
Question 1:
(i) The bar graph shows the marks obtained by a student in various subjects in an examination. (ii) The student scores very well in mathematics, as the height of the corresponding bar is the highest. (iii) The student scores badly in Hindi, as the height of the corresponding bar is the lowest. (iv) Average marks = 60+35+75+50+605 = 2805= 56 Answer:
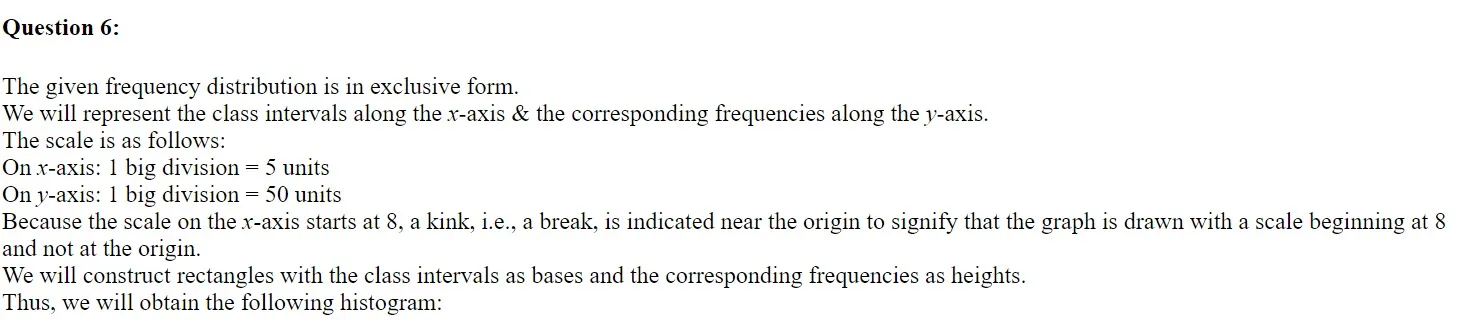
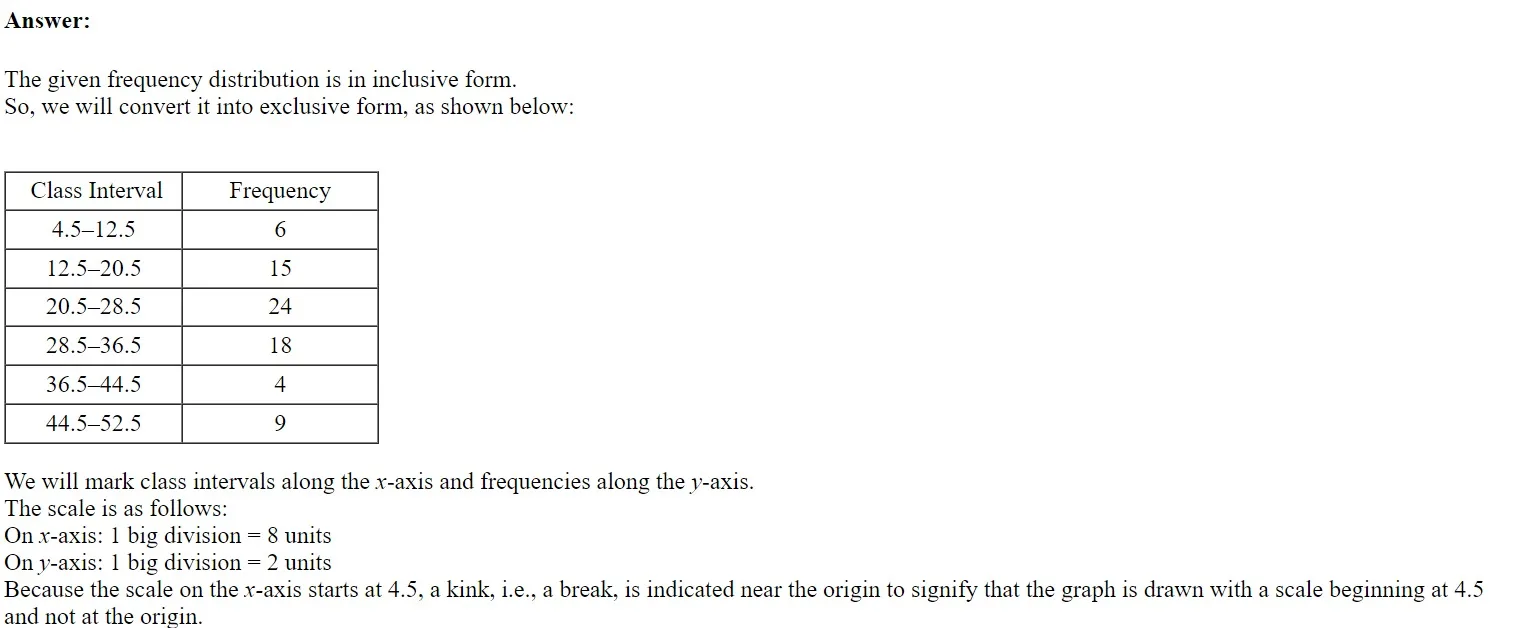
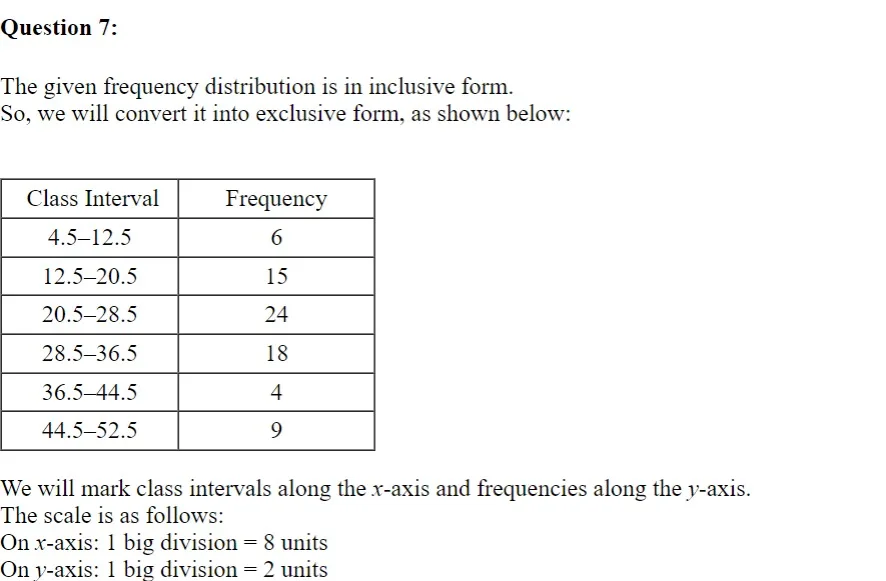
The given frequency distribution is in exclusive form.
We will represent the class intervals [daily wages (in rupees)] along the
x
-axis & the corresponding frequencies [number of workers] along the
y
-axis.
The scale is as follows:
On
the
x
-axis: 1 big division = 40 rupees
On the
y
-axis: 1 big division = 2 workers
Because the scale on the
x
-axis starts at 340, a kink, i.e., a break, is indicated near the origin to signify that the graph is drawn with a scale beginning at 340
and not at the origin.
You can get the RS Aggarwal Class 9 Maths Solutions in PDF format. Students will benefit much in terms of timely review and exam preparation from this. To go to board class, students have to complete a significant portion of their lives in class nine. Each chapter's solutions are given clearly, and downloading the PDF to your PC for offline reading is a helpful feature.
One of this book's best qualities is its ability to cover a wide range of issues, from easy, conceptual ones that don't require much thought to difficult ones that require a lot of the student's attention.
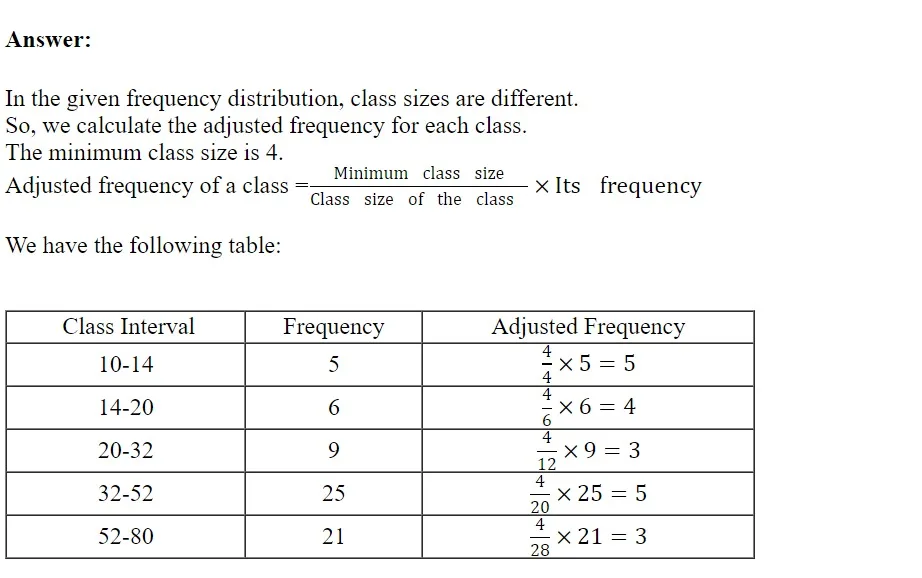
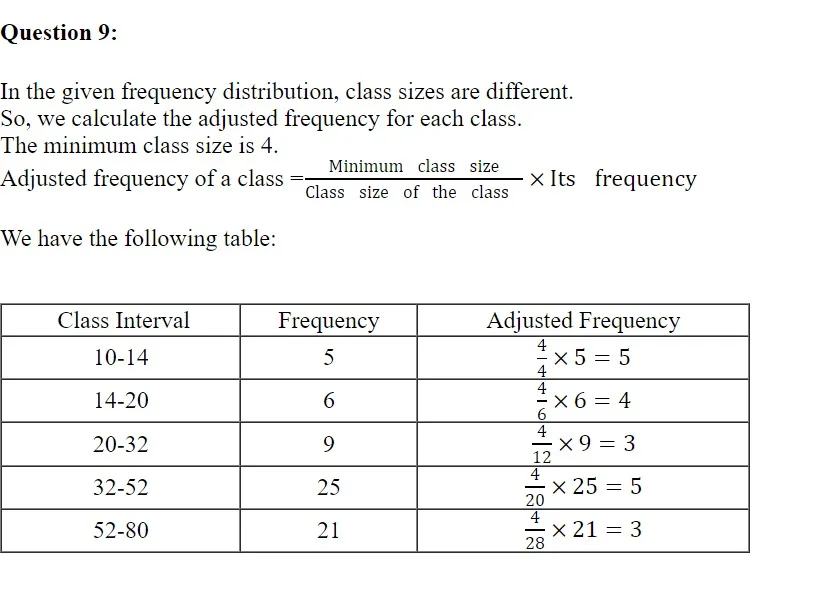
Question 2:
The given frequency distribution is in exclusive form. We will represent the class intervals [daily wages (in rupees)] along the x -axis & the corresponding frequencies [number of workers] along the y -axis. The scale is as follows: On the x -axis: 1 big division = 40 rupees On the y -axis: 1 big division = 2 workers Because the scale on the x -axis starts at 340, a kink, i.e., a break, is indicated near the origin to signify that the graph is drawn with a scale beginning at 340 and not at the origin.Answer:
The given frequency distribution is in exclusive form. We will represent the class intervals [daily earnings (in rupees)] along the x -axis & the corresponding frequencies [number of stores] along the y -axis. The scale is as follows: On the x -axis: 1 big division = 50 rupees On the y -axis: 1 big division = 1 store Because the scale on the x- axis starts at 700, a kink, i.e., a break is indicated near the origin to signify that the graph is drawn with a scale beginning at 700 and not at the origin. We will construct rectangles with the class intervals as bases and the corresponding frequencies as heights.
Benefits of RS Aggarwal Solutions Class 9 Maths Chapter 17
| CBSE Class 9 Maths Syllabus | CBSE Class 9 Science Syllabus |
| CBSE Class 9 Computer Application Syllabus | CBSE Class 9 Social Science Syllabus |
RS Aggarwal Solutions Class 9 Maths Chapter 17 FAQs
Is RS Aggarwal easy?
Solving all the problems of RS Aggarwal is a privilege of the highest order! However, not all problems are easy to solve.
How good is RS Aggarwal?
This book is outstanding. This book is good for those students who can do maths better.
Is RS Aggarwal enough for board?
Yes RS Aggarwal and NCERT is sufficient for class 10th for scoring 95+ . Even if you do NCERT 3 to 5 times then you can score 95+ marks.

🔥 Trending Blogs
Talk to a counsellorHave doubts? Our support team will be happy to assist you!

Check out these Related Articles


Join 15 Million students on the app today!

Free Learning Resources
PW Books
Notes (Class 10-12)
PW Study Materials
Notes (Class 6-9)
Ncert Solutions
Govt Exams
Our Other Websites
Class 6th to 12th Online Courses
Govt Job Exams Courses
UPSC Coaching
Defence Exam Coaching
Gate Exam Coaching
Other Exams
Know about Physics Wallah
Physics Wallah is an Indian edtech platform that provides accessible & comprehensive learning experiences to students from Class 6th to postgraduate level. We also provide extensive NCERT solutions, sample paper, NEET, JEE Mains, BITSAT previous year papers & more such resources to students. Physics Wallah also caters to over 3.5 million registered students and over 78 lakh+ Youtube subscribers with 4.8 rating on its app.
We Stand Out because
We provide students with intensive courses with India’s qualified & experienced faculties & mentors. PW strives to make the learning experience comprehensive and accessible for students of all sections of society. We believe in empowering every single student who couldn't dream of a good career in engineering and medical field earlier.
Our Key Focus Areas
Physics Wallah's main focus is to make the learning experience as economical as possible for all students. With our affordable courses like Lakshya, Udaan and Arjuna and many others, we have been able to provide a platform for lakhs of aspirants. From providing Chemistry, Maths, Physics formula to giving e-books of eminent authors like RD Sharma, RS Aggarwal and Lakhmir Singh, PW focuses on every single student's need for preparation.
What Makes Us Different
Physics Wallah strives to develop a comprehensive pedagogical structure for students, where they get a state-of-the-art learning experience with study material and resources. Apart from catering students preparing for JEE Mains and NEET, PW also provides study material for each state board like Uttar Pradesh, Bihar, and others
Copyright © 2026 Physicswallah Limited All rights reserved.