

T-Test Formula, Definition, Solved Examples

T-Test Formula: The t-test equation is a concept used for comparing the mean values of two datasets, allowing us to determine whether they stem from the same population or differ. The t-score derived is then compared against the critical value found in the t-table. A higher t-score suggests disparity between the groups, while a lower t-score indicates similarity between them.
What is the T-Test Formula
The T-test formula is used on sample populations and relies on the mean, variance, and standard deviation of the compared data. Three types of t-tests can be conducted based on the collected n number of samples:
- One-sample test
- Independent sample t-test
- Paired samples t-test
The critical value is derived from the t-table, considering the degrees of freedom (d f = n-1) and a corresponding α value (usually 0.05 or 0.1). If the statistically obtained t-test > critical value, the initial hypothesis is refuted, leading to the conclusion that the results are significantly different.
One-Sample T-Test Formula
The one-sample t-test is utilized to compare the mean of a population ‾ x derived from n samples with a predetermined theoretical mean μ.
One-Sample T-Test Formula
t = ( x −μ) / σ/ √ n
Here, σ/ √ n represents the standard error.
Independent Sample T-Test Formula
The Student's t-test is used to assess and compare the means of two separate sample groups. It aids in determining whether the means of the two datasets exhibit statistically significant differences from each other.
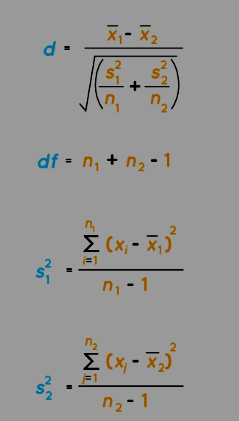
In the given formula,
t represents the Student's t-test statistic,
‾ x 1 stands for the mean of the first group.
‾ x 2 represents the mean of the second group.
s 1 is the standard deviation of group 1.
s 2 is the standard deviation of group 2.
n 1 denotes the number of observations in group 1.
n 2 signifies the number of observations in group 2.
Paired Samples T-Test Formula
If two sets of variable distributions show a high level of correlation, such as pre and post-test results from the same individuals, the paired samples t-test is utilized.
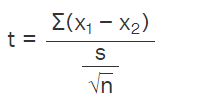
In this formula,
- t stands for the Student's t-test,
- ‾ x 1 − ‾ x 2 represents the mean difference of the pairs.
- s signifies the standard deviation.
- n denotes the sample size.
T-Test Formula Solved Examples
Examples 1: Assessing the Weight of Mangoes Given a sample of 20 mangoes, the task is to determine whether the average weight significantly differs from the known population average of 70 grams. The sample's mean weight is 70.55 grams, with a sample standard deviation of 2.82 grams. A one-sample T-test is conducted.
Solution: To initiate a T-test, we establish two hypotheses:
Null hypothesis: The sample mean weight of mangoes is equal to the known population mean of 70 grams.
Alternative hypothesis: The sample mean weight of mangoes is different from the known mean value.
Then, we calculate the degrees of freedom (d f ):
d f = n – 1 = 20 – 1 = 19 and set the significance level (α) as 0.05.
Next, the t-value is computed using the formula: t= (70.55−70) /(2.82 / √ 20) ⇒ t≈1.041
Referring to the t-distribution table, we find 1.041 < 2.093 (for a p-value at α = 0.05). Therefore, the null hypothesis holds true. Thus, we conclude that the sample does not significantly differ from the population.
Example2: Evaluating Scores of Two Teams The task involves determining if there is a significant difference in the average scores between two teams, Team A and Team B. The provided data for the scores is utilized for an Independent Samples T-test.
Solution: Based on the problem, the null and alternative hypotheses are set as follows:
Null hypothesis: The means of the two groups are equal (μ A = μ B ).
Alternative hypothesis: The means of the two groups are different (μ A ≠ μ B ). Next, the sample means (x̄ A and x̄ B ) and sample standard deviations (σ A and σ B ) are calculated:
For Team A: Sample size (n A ) = 5 Sample mean (x̄ A ) = 66.6 Sample standard deviation (σ A ) ≈ 2.607
For Team B: Sample size (n B ) = 5 Sample mean (x̄ B ) = 65.8 Sample standard deviation (σ B ) ≈ 2.588
The t-value is then calculated using the formula:
t = (x̄ A – x̄ B ) / √((σA 2 / n A ) + (σB 2 / n B ))
t= ( 5 2.607 2 )+( 5 2.588 2 ) 66.6−65.8 ⇒ ≈ 0.296
t≈0.296
Next, the degrees of freedom are computed:
df=n A +n B −2=5+5−2=8
At a significance level of 0.05, referencing the t-table, the critical t-value is 2.306. As the calculated t-value is less than the critical t-value, the null hypothesis is not rejected, indicating that there is no significant difference between the average scores of the two teams.
Explore Now Online Course of Class 9 Neev Fastrack 2024 and Class 10 Udaan Fastrack 2024 to enhance your Maths knowledge. and build a strong foundation.
| Related Links | |
| Function Notation Formula | Hexagonal Pyramid Formula |
| Hypothesis Testing Formula | Interquartile Range Formula |
T-Test Formula FAQs
What is a T-Test?
What are the main types of T-Tests?
What's the formula for a One-Sample T-Test?
How do T-Tests help in statistical analysis?