

Interquartile Range Formula, Definition, Solved Examples

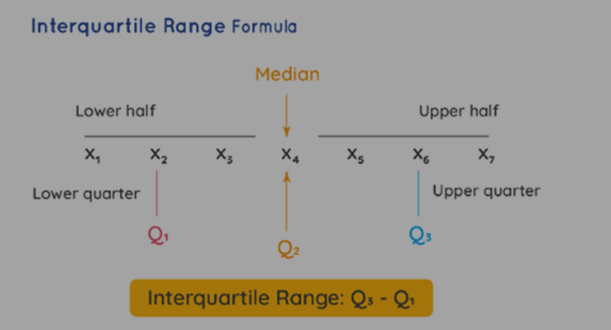
Interquartile Range Formula: The formula for the Interquartile Range (IQR) is used to determine the spread between the third quartile (Q 3 ) and the first quartile (Q 1 ). This calculation evaluates the variability by dividing a dataset into quartiles. Quartiles, identified as Q 1 , Q 2 , and Q 3 , partition the data into four equal parts.
Q 1 denotes the point that separates the first half of the ordered dataset, while Q 2 represents the median value. Q 3 , on the other hand, divides the second half of the ordered data set.
Let's discuss the IQR formula and explore its application through a few solved examples.
What Is the Formula for Interquartile Range
The Interquartile Range (IQR) formula serves as a measure of the middle 50% of a dataset. It represents the smallest dispersion measure in statistics. This range quantifies the difference between the upper and lower quartiles.
Interquartile Range Formula: Interquartile range = Upper Quartile – Lower Quartile
Interquartile Range Formula IQR=Q 3 −Q 1
Where: IQR = Interquartile range (also represented as Q 2 )
Q 1 = (1/4)[(n + 1)] th term )
Q 3 = (3/4)[(n + 1)] th term )
n = number of data points
Finding the Interquartile Range (IQR)
Here are the steps to calculate the IQR:
- Arrange the data points in ascending order. Q 2 represents the median of the dataset.
- If the number of data points is odd, the middle term is (n+1)/2.
- If the number of data points is even, the median is the mean of the two middle points.
- Q 1 is the median of the data points to the left of the median found in step 2.
- Q 3 is the median of the data points to the right of the median found in step 2.
- IQR can be calculated using the formula: IQR=Q 2 =Q 3 −Q 1
Interquartile Range Formula Solved Examples
Example 1: Compute the Interquartile Range for the following dataset: {22, 25, 28, 30, 32, 35, 40, 42, 45}
Given: Dataset = {22, 25, 28, 30, 32, 35, 40, 42, 45}
Step 1: Arrange the dataset in ascending order: {22, 25, 28, 30, 32, 35, 40, 42, 45}
Step 2: Determine the quartiles. n=9 (number of terms)
Q 2 (median): Since the number of terms is odd, the median will be the middle term, which is the ( 9 + 1 ) / 2 = 5 (9+1)/2=5th term:
Q 2 =32
Next, to determine Q1 and Q3, the dataset is divided into two segments:
Lower half: {22, 25, 28, 30, 32}
Upper half: {35, 40, 42, 45}
Q 1 (first quartile) is the median of the lower half:
Q 1 =median of {22,25,28,30,32}=28
Q 3 (third quartile) is the median of the upper half:
Q 3 =median of {35,40,42,45}=38.5
Step 3: Calculate the Interquartile Range using the formula:
Interquartile Range Formula IQR=Q 3 −Q 1 =38.5−28=10.5
Thus, the Interquartile Range (IQR) for the given dataset is 10.5.
Example 2: Determine the Interquartile Range for the following set of numbers: {12, 15, 18, 21, 24, 28, 31, 35, 39, 42, 45}
Given: Dataset = {12, 15, 18, 21, 24, 28, 31, 35, 39, 42, 45}
Step 1: Arrange the data in ascending order: {12, 15, 18, 21, 24, 28, 31, 35, 39, 42, 45}
Step 2: Determine the quartiles. n=11 (number of terms)
Q 2 (median): Since the number of terms is odd, the median will be the middle term, which is the ( 11 + 1 ) / 2 = 6 (11+1)/2=6th term:
Q 2 =28 Split the dataset into two parts:
Lower half: {12, 15, 18, 21, 24}
Upper half: {31, 35, 39, 42, 45}
Q 1 (first quartile) is the median of the lower half:
Q 1 =median of {12,15,18,21,24}=18
Q 3 (third quartile) is the median of the upper half:
Q 3 =median of {31,35,39,42,45}=37
Step 3: Calculate the Interquartile Range using the formula:
Interquartile Range Formula IQR=Q 3 −Q 1 =37−18=19
T hus, the Interquartile Range (IQR) for the given dataset is 19.
Explore Now Online Course of Class 9 Neev Fastrack 2024 and Class 10 Udaan Fastrack 2024 to enhance your Maths knowledge. and build a strong foundation.
| Related Links | |
| Distance Formula | Taylor Series Formula |
| Tangent Line Formula | Tangent to a Circle Formula |
Interquartile Range Formula FAQs
What is the Interquartile Range (IQR)?
How is IQR Calculated?
What does IQR measure?
Why is IQR important?
What are the steps to find IQR?