

Hypothesis Testing Formula, Definition, Solved Examples
Hypothesis Testing Formula: Statistics, as an applied branch of mathematics, involves the collection, description, analysis, and interpretation of numerical data. It heavily relies on differential and integral calculus, linear algebra, and probability theory in formulating its mathematical concepts. Statisticians focus on deriving accurate conclusions about extensive populations and general patterns from the characteristics and behavior observed in small sample sizes. These smaller samples act as reflections of a larger population or a limited set of instances within a broader pattern.
Hypothesis Testing Formula
Hypothesis testing involves statisticians checking a hypothesis about a population measure. The way they do this is influenced by the data type and study goals. Using sample data to confirm a hypothesis is what hypothesis testing is all about. This data could come from a larger population or a data collection method.
Steps in Hypothesis Testing
Step 1: The initial phase involves identifying the research questions and hypotheses. Remember, these options are mutually exclusive. If one theory claims a truth, the other must counter it.
Step 2: Consider the statistical assumptions, such as independence of observations, data normality, random errors and their probability distribution, randomization during sampling, and similar factors.
Step 3: The third step is about choosing the test to verify the hypothesis. Simultaneously, determine the method for testing the null hypothesis using sample data.
Step 4: In the fourth stage, the data from a sample is examined. This is when assessments such as mean values, normal distributions, t distributions, and z-scores are sought.
Step 5: The final stage involves making a decision on whether to reject the null hypothesis in favor of the alternative or to retain it.
Hypothesis testing is used to determine whether the evidence within a sample dataset is substantial enough to validate or refute research conditions for the entire population. The Z-test serves to assess the assumption within a specific sample. Typically, in hypothesis testing, we compare two sets by comparing them against a synthesized dataset and an idealized model.
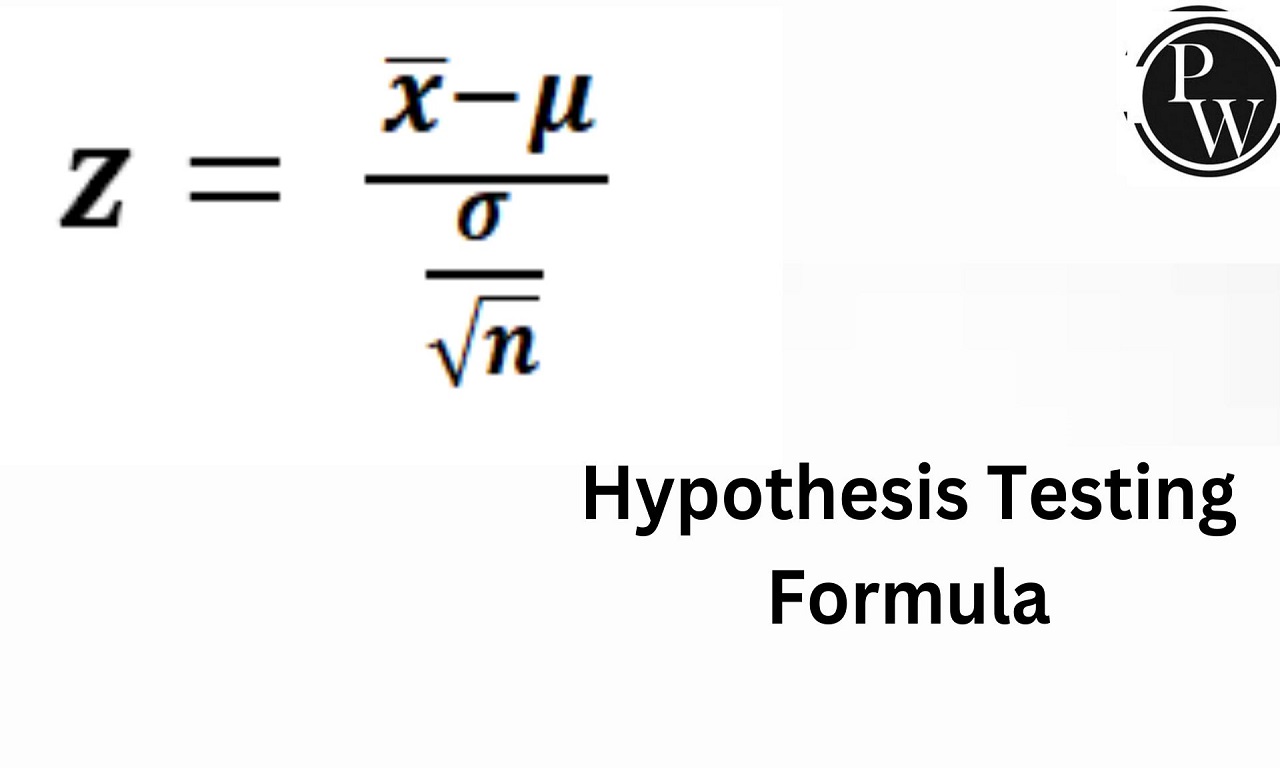
Hypothesis Testing Formula
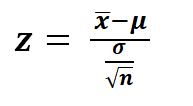
In this context.
![]() symbolises the sample mean,
symbolises the sample mean,
μ denotes the population mean,
σ stands for the standard deviation, and
n represents the sample size.
Hypothesis Testing Formula Solved Examples
Example 1: Given: x =25.5 μ=24 σ=4 n=36
Solution: Using the Hypothesis Testing Formula:
Substituting the given values:
z= 25.5−24/ 4 / √ 36
z= 1.5 / 4 / 6
z= 1.5 / 0.6667
z≈2.25
Example 2: Given: ‾ x =80 μ=75 σ=8 n=64
Solution: Using the Hypothesis Testing Formula:
Plugging in the provided values:
z= 80−75/ 8 / √ 64
z= 5 / 8/ 8
z= 5 / 1
z= 5
Example 3: Given: ‾ x =110 μ=100 σ=15 n=25
Solution: Using the Hypothesis Testing Formula:
Plugging in the provided values:
z= 110−100/ 15 / √ 25
z= 10 / 15/ 5
z= 10 / 3
z= 3.33
Example 4: Given: ‾ x =32 μ=30 σ=5 n=49
Solution: Using the Hypothesis Testing Formula:
Plugging in the provided values:
z= 32−30/ 5 / √ 49
z= 3 / 5/ 7
z= 5 / 0.7143
z= 2.80
Example 5: Given: ‾ x =210 μ=200 σ=25 n=100
Solution: Using the Hypothesis Testing Formula:
Plugging in the provided values:
z= 210−200/ 25 / √ 100
z= 10 / 25/ 10
z= 10 / 2.5
z= 4
Example 6: Given: ‾ x =95 μ=100 σ=12 n=36
Solution: Using the Hypothesis Testing Formula:
Plugging in the provided values:
z= 95−100/ 12 / √ 36
z= -5 / 12/ 6
z= 5 / 2
z= -2.5
These examples illustrate how to apply the z-test formula using the given sample mean, population mean, standard deviation, and sample size to calculate the z-value for hypothesis testing.
Explore Now Online Course of Class 9 Neev Fastrack 2024 and Class 10 Udaan Fastrack 2024 to enhance your Maths knowledge. and build a strong foundation.
| Related Links | |
| Unit Rate Formula | Uniform Distribution Formula |
| Area of Trapezoid Formula | Distance Formula |
Hypothesis Testing Formula FAQs