

CBSE Class 10 Maths Notes Chapter 14 Statistics
Here, we have provided CBSE Class 10 Maths Notes Chapter 14. Students can view these CBSE Class 10 Maths Notes Chapter 14 Statistics before exams for better understanding of the chapter.

CBSE Class 10 Maths Notes Chapter 14: Understanding the material and getting good scores on the board exams depend heavily on revision. Every chapter should have revision notes, especially in disciplines like mathematics where there are many formulas and data to remember. We here are providing the Class 10 Maths Chapter 14 notes in PDF format on this page to help with your preparation.
Our class 10 math statistics notes contain all the necessary information and formulas for students to swiftly and easily solve the chapter's problem.CBSE Class 10 Maths Notes Chapter 14 PDF
This is the link to the Class 10 statistics brief notes. This will cover key statistical ideas like grouped and ungrouped data, measures of central tendencies like mean, median, and mode, how to determine the mean, median, and mode, and how these relate to one another with further examples.CBSE Class 10 Maths Notes Chapter 14 PDF
CBSE Class 10 Maths Notes Chapter 14
Introduction to Statistics
Ungrouped Data
Data that has not been sorted is original or raw data. There are no groupings assigned to the observations. For instance, the following are the ages of all the students in the teacher's kindergarten class: 3, 3, 4, 3, 5, 4, 3, 3, 4, 3, 3, 3, 3, 4, 3, 27. According to the data, there is only one adult present in the class—the teacher. When the data collection is small, working with ungrouped data is simple.Grouped Data
In grouped data, observations are organized in groups. For example, a class of students got different marks in a school exam. The data is tabulated as follows:| Mark interval | 0-20 | 21-40 | 41-60 | 61-80 | 81-100 |
| No. of Students | 13 | 9 | 36 | 32 | 10 |
Frequency
The frequency of an observation in data is its occurrence count. For instance, the frequency of marks between 90 and 100 has four if four students have received scores in that range.Class Interval
All observations within a range are considered to be part of the class in which the data is sorted into class intervals. Class width = upper class limit – lower class limitExample: Consider a class interval 31 – 40.
Here, the lower class limit is 31, and the upper class limit is 40. Hence, the size/width of the class interval 31 – 40 is calculated as follows: Class interval size = Upper class limit – Lower class limit Class interval size = 40 – 31 = 9 Therefore, the size of the class interval is 9.CBSE Class 10 Syllabus 2024-25
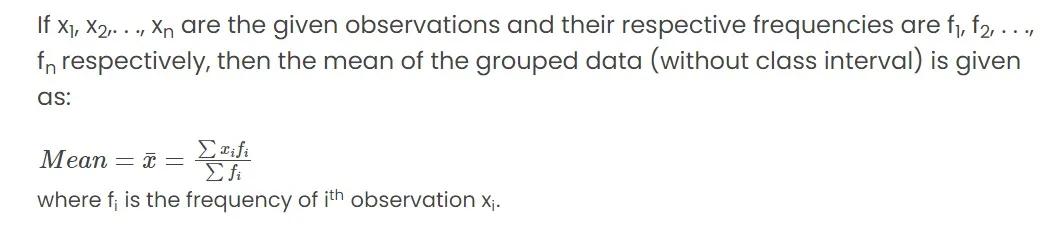
Mean
 For example, the marks scored by the 30 students of class 10 are given below:
| Marks obtained (x i ) | 10 | 20 | 36 | 40 | 50 | 56 | 60 | 70 | 72 | 80 | 88 | 92 | 95 |
| No. of students | 1 | 1 | 3 | 4 | 3 | 2 | 4 | 4 | 1 | 1 | 2 | 3 | 1 |
| Marks scored (x i ) | No. of students (f i ) | x i f i |
| 10 | 1 | 10 |
| 20 | 1 | 20 |
| 36 | 3 | 108 |
| 40 | 4 | 160 |
| 50 | 3 | 150 |
| 56 | 2 | 112 |
| 60 | 4 | 240 |
| 70 | 4 | 280 |
| 72 | 1 | 72 |
| 80 | 1 | 80 |
| 88 | 2 | 176 |
| 92 | 3 | 276 |
| 95 | 1 | 95 |
| Sum | Σf i = 30 | Σx i f i = 1779 |
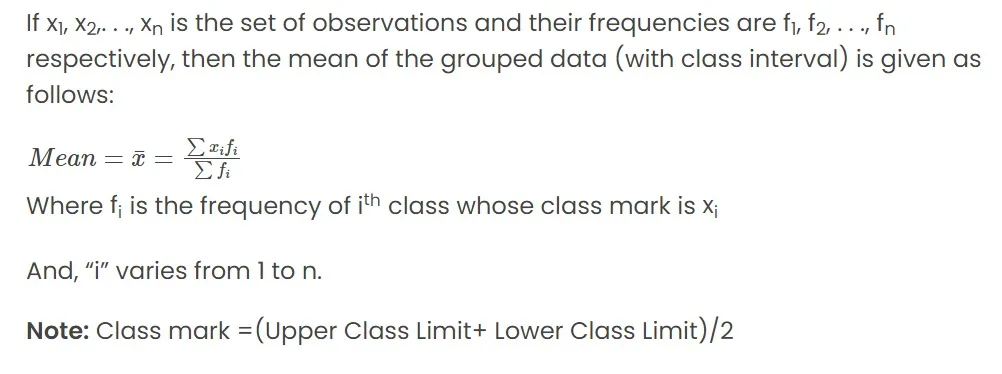
Finding the mean for grouped data when class intervals are given
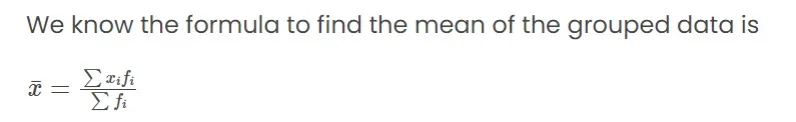
Direct Method to Find Mean
Step 1: Divide the data into intervals and determine the frequency of each period for each class. Step 2: Calculate the class mark by dividing the upper and lower class limits by their midpoint. Step 3: For each class, tabulate the product of the class mark and the associated frequency. Determine their total (∑xifi). Step 4: To find the mean, divide the total above by the sum of frequencies (∑fi). If you use the direct technique, the formula to find the mean is: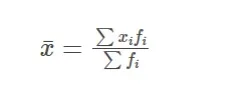
Assumed Mean Method to Find Mean
Step 1: Divide the data into intervals and determine the frequency of each period for each class. Step 2: Calculate the class mark by dividing the upper and lower class limits by their midpoint. Step 3: Designate by ′a′ the presumed mean, which is typically one of the xi values near the middle. Step 4: Determine how ′a′ deviates from each of the x′is di=xi−a Step 5: Calculate the deviations' mean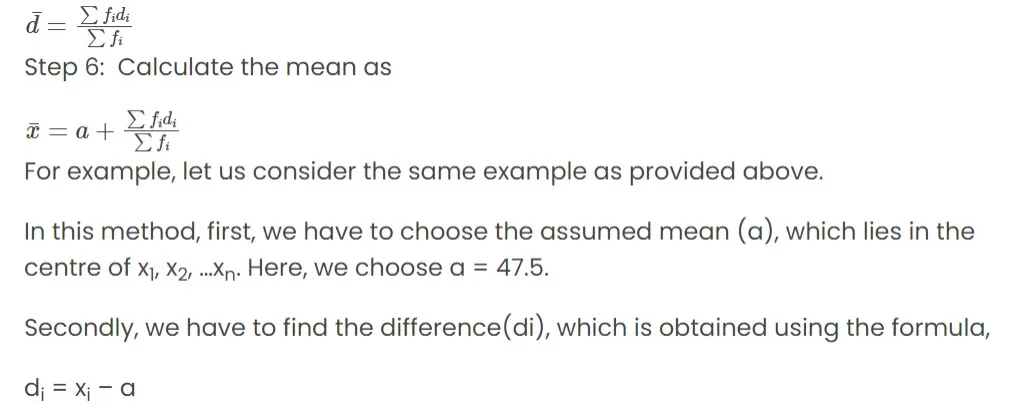 Let's now examine how to use the assumed mean approach to find the mean for the given data.
| Class Interval | No.of Students (f i ) | Class Mark (x i ) | d i = x i – a | f i d i |
| 10 – 25 | 2 | 17.5 | -30 | -60 |
| 25 – 40 | 3 | 32.5 | -15 | -45 |
| 40 – 55 | 7 | 47.5 | 0 | 0 |
| 55 – 70 | 6 | 62.5 | 15 | 90 |
| 70 – 85 | 6 | 77.5 | 30 | 180 |
| 85 – 100 | 6 | 92.5 | 45 | 270 |
| Sum | Σf i = 30 | Σf i d i = 435 |
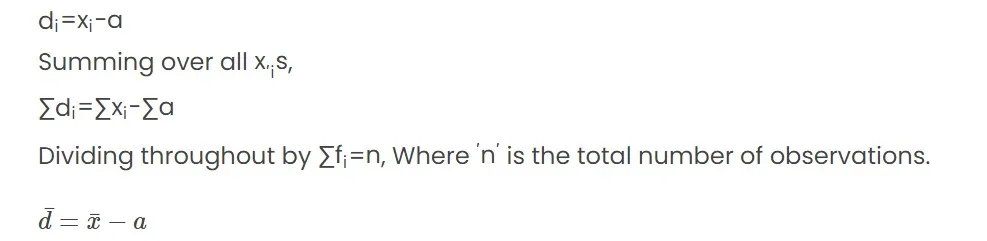
The Relation Between the Mean of Deviations and Mean
Step-Deviation Method to Find Mean
Step 1: Divide the data into intervals and determine the frequency of each period for each class. Step 2: Calculate the class mark by dividing the upper and lower class limits by their midpoint. Step 3: Use ′a′ to indicate the assumed mean, which is typically one of the x′is in the middle.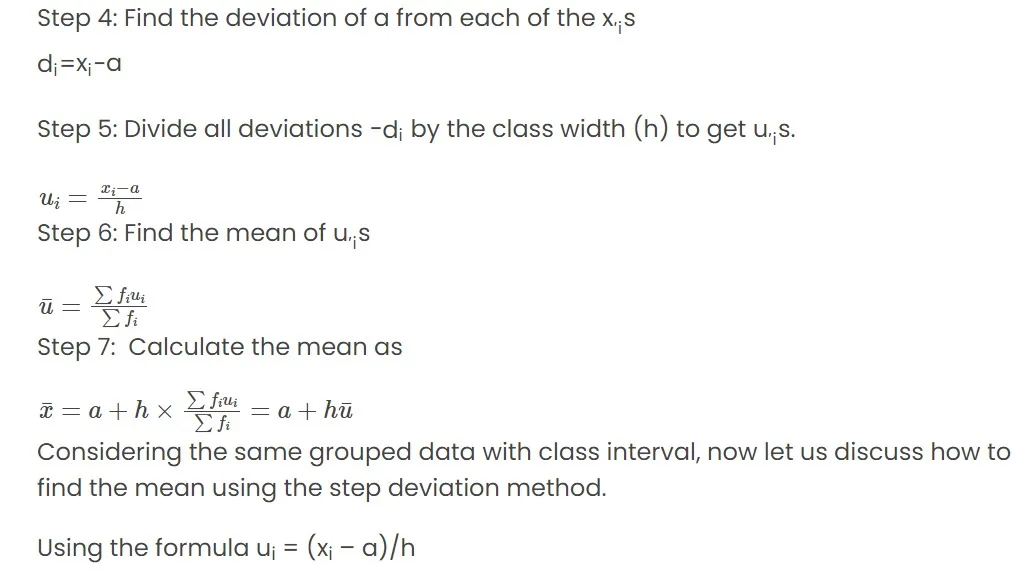 Here, a = 47.5, which is the assumed mean
Class size, h = 15.
Here, a = 47.5, which is the assumed mean
Class size, h = 15.
| Class Interval | No.of Students (f i ) | Class Mark (x i ) | d i = x i – a | u i = (x i – a)/h | f i u i |
| 10 – 25 | 2 | 17.5 | -30 | -2 | -4 |
| 25 – 40 | 3 | 32.5 | -15 | -1 | -3 |
| 40 – 55 | 7 | 47.5 | 0 | 0 | 0 |
| 55 – 70 | 6 | 62.5 | 15 | 1 | 6 |
| 70 – 85 | 6 | 77.5 | 30 | 2 | 12 |
| 85 – 100 | 6 | 92.5 | 45 | 3 | 18 |
| Sum | Σf i = 30 | Σf i u i = 29 |
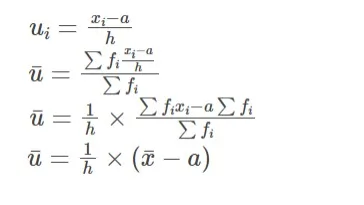
Relation Between Mean of Step- Deviations (u) and Mean
Important Relations Between Methods of Finding Mean
The outcome of all three approaches to calculating mean is the same. Applying the step deviation approach is simpler when there is a common component among all the deviations. Simplified variations of the direct approach are the assumed mean method and the step deviation technique.Median
Finding the median of grouped data when class intervals are not given
Step 1: Sort the observations by frequency in either ascending or descending order by tabulating them. Step 2: Calculate the cumulative frequency up to each observation and add it to the table as a column called cumulative frequency. Step 3: The observation whose cumulative frequency is somewhat larger than or equal to (n+1)/2 is the median if the number of observations is odd. The average of observations whose cumulative frequency is somewhat more than or equal to n/2 and (n/2)+1 is known as the median if the number of observations is even. Below are the grades that 100 students received out of a possible 50. Determine the data's median:| Marks scored | 20 | 29 | 28 | 33 | 42 | 38 | 43 | 25 |
| No.of students | 6 | 28 | 24 | 15 | 2 | 4 | 1 | 20 |
| Marks Scored | No. of students |
| 20 | 6 |
| 25 | 20 |
| 28 | 24 |
| 29 | 28 |
| 33 | 15 |
| 38 | 4 |
| 42 | 2 |
| 43 | 1 |
| Sum | 100 |
| Marks Scored | No. of students | Cumulative frequency |
| 20 | 6 | 6 |
| 25 | 20 | 26 |
| 28 | 24 | 50 |
| 29 | 28 | 78 |
| 33 | 15 | 93 |
| 38 | 4 | 97 |
| 42 | 2 | 99 |
| 43 | 1 | 100 |
Cumulative Frequency
The process of accumulating all the frequencies up to a specific threshold yields the cumulative frequency.Finding the median for grouped data when class intervals are given
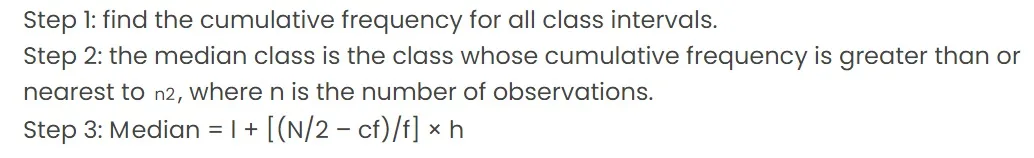 Where,
l
=
lower limit of median class,
n
=
number of observations,
c
f
=
cumulative frequency of class preceding the median class,
f
=
frequency of median class,
h
=
class size (assuming class size to be equal).
Where,
l
=
lower limit of median class,
n
=
number of observations,
c
f
=
cumulative frequency of class preceding the median class,
f
=
frequency of median class,
h
=
class size (assuming class size to be equal).
Relation Between the Less Than and the More Than Type Curves
The median of the grouped frequency distribution is found at the intersection of the ogives of the more than and less than kinds.Mode
The most often occurring value in a particular data collection is called the mode in statistics. Stated otherwise, the mode refers to the data that exhibits the highest frequency. For example, 4, 12, 5, 6, 5, 8, and 5 are the given set of data. Here, the data with the highest frequency is 5, which is repeated thrice. Therefore, the mode of the given data is 5.Benefits of CBSE Class 10 Maths Notes Chapter 14
Because the notes are written by specialists who have done considerable research on the subjects, the Class 10 Maths Chapter Statistics notes are 100% correct. The Class 10 Maths Statistics notes are provided in a PDF format, allowing students to review the material whenever and wherever is most convenient for them. The Class 10 Maths Chapter 14 notes help students quickly and easily remember all of the previously taught concepts in the chapter, which is especially helpful during exams when they have a limited amount of time to review the entire curriculum. Students can familiarise themselves with the concepts and determine the chapter's essential components by using the Class 10 Maths Statistics notes. The use of multiple study materials to prepare a chapter during revision is curtailed in the Class 10 Maths Chapter 14 notes.CBSE Class 10 Maths Notes Chapter 14 FAQs
What is chapter 14 in maths class 10?
Chapter 14 Statistics covers a variety of topics such as mean, median, and mode of grouped data, cumulative frequency, representation of cumulative frequency data in the graphical form, and obtaining the median of grouped data.
Which is the hardest subject in class 10?
Among these subjects, many students find Mathematics to be challenging due to its abstract nature and the need for strong problem-solving skills. Science subjects like Physics, Chemistry, and Biology can also be challenging for some students, especially if they struggle with concepts and equations.
Which is the most easiest chapter in class 10?
In class 10th Math, Real numbers cover some important topics like properties of positive integers, fundamental theorem of arithmetics which are the easiest chapters to solve.


🔥 Trending Blogs

Check out these Related Articles


Join 15 Million students on the app today!

Free Learning Resources
PW Books
Notes (Class 10-12)
PW Study Materials
Notes (Class 6-9)
Ncert Solutions
Govt Exams
Our Other Websites
Class 6th to 12th Online Courses
Govt Job Exams Courses
UPSC Coaching
Defence Exam Coaching
Gate Exam Coaching
Other Exams
Know about Physics Wallah
Physics Wallah is an Indian edtech platform that provides accessible & comprehensive learning experiences to students from Class 6th to postgraduate level. We also provide extensive NCERT solutions, sample paper, NEET, JEE Mains, BITSAT previous year papers & more such resources to students. Physics Wallah also caters to over 3.5 million registered students and over 78 lakh+ Youtube subscribers with 4.8 rating on its app.
We Stand Out because
We provide students with intensive courses with India’s qualified & experienced faculties & mentors. PW strives to make the learning experience comprehensive and accessible for students of all sections of society. We believe in empowering every single student who couldn't dream of a good career in engineering and medical field earlier.
Our Key Focus Areas
Physics Wallah's main focus is to make the learning experience as economical as possible for all students. With our affordable courses like Lakshya, Udaan and Arjuna and many others, we have been able to provide a platform for lakhs of aspirants. From providing Chemistry, Maths, Physics formula to giving e-books of eminent authors like RD Sharma, RS Aggarwal and Lakhmir Singh, PW focuses on every single student's need for preparation.
What Makes Us Different
Physics Wallah strives to develop a comprehensive pedagogical structure for students, where they get a state-of-the-art learning experience with study material and resources. Apart from catering students preparing for JEE Mains and NEET, PW also provides study material for each state board like Uttar Pradesh, Bihar, and others
Copyright © 2026 Physicswallah Limited All rights reserved.