CBSE Class 7 Maths Notes Chapter 3
CBSE Class 7 Maths Notes Chapter 3: This chapter covers the methods by which we can manipulate data and save it in different formats. According to the CBSE board, this chapter is crucial since it teaches us how to analyze data from many sectors. To review the entire curriculum and get higher exam scores, students can download the Class 7 Maths NCERT Solutions.
Topics Covered in the CBSE Class 7 Maths Notes Chapter 3 Overview
The following subjects were covered in Chapter 3 Data Handling; students in Class 7 should make note of them and make sure they have addressed them in their preparation and review.- Introduction to Data Handling
- Collecting Data
- Organisation of Data
- Representation Values
- Arithmetic Mean
- Range
- Mode
- Median
- Use of Bar Graph with Different Purposes
- Chance and Probability
CBSE Class 7 Maths Notes Chapter 3 PDF
Here is the link to download the CBSE Class 7 Maths Notes Chapter 3 Data Handling in PDF format. The major objective is to help students understand and resolve these problems. We have prepared the CBSE Class 7 Maths Notes Chapter 3 Data Handling and have solved the problems step-by-step with detailed explanations.CBSE Class 7 Maths Notes Chapter 3 PDF Download
CBSE Class 7 Maths Notes Chapter 3
- We are able to organise and draw conclusions from our experiences with the help of data gathering, recording, and presentation.
- Before beginning the data collection process, we must decide how we will use the information. The collected data have to be arranged in an easily comprehensible table for analysis.
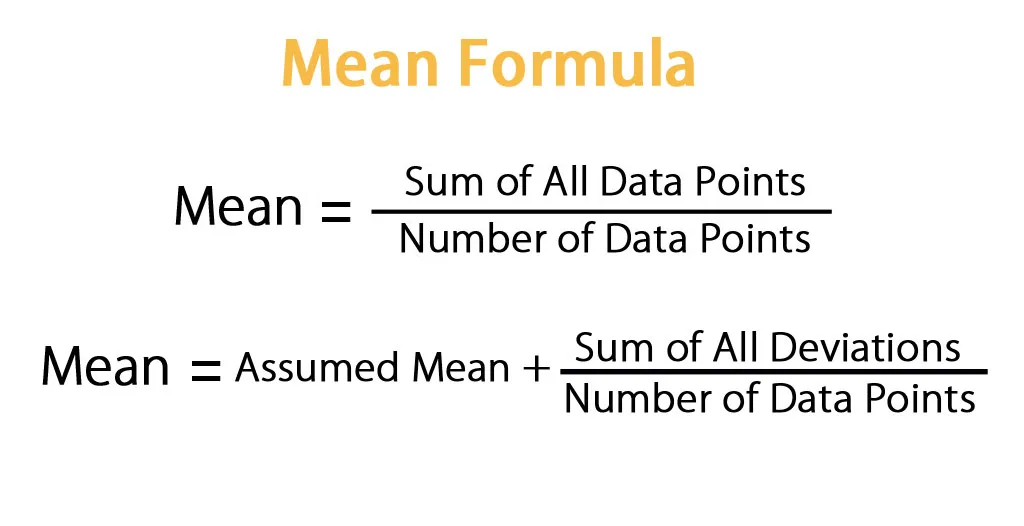
- Finding the sum of the numbers and dividing it by the total number of values (n) in the set will get the average of the set of numbers.
- Measures of central tendency are the average, median, and mode of a set of data.
-
One of the representative values of data is the arithmetic mean.
- The mode is a different kind of central trend or representative value. The mode is the most prevalent observation within a set of observations. A data set's values are all in mode if each value only appears once.
- Since none of them occur regularly, we sometimes refer to this data as having no mode.
- Another kind of representative value is the median. Half of the observations are below, and half are above this value, which is in the middle of the data set.
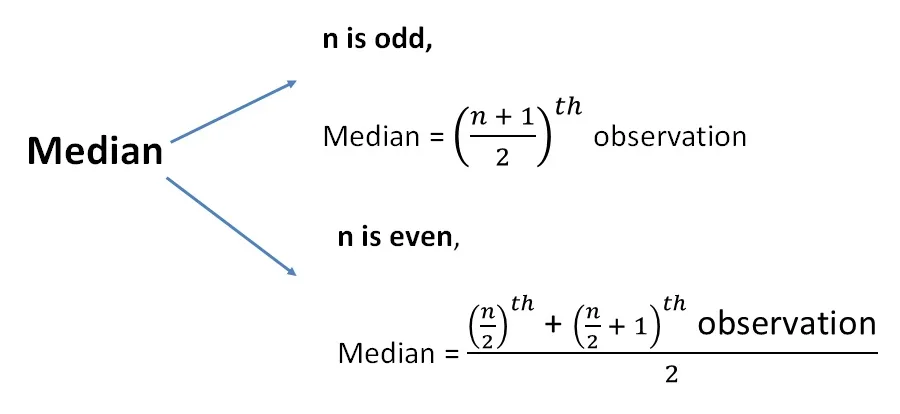
-
A bar graph is a visual representation of numbers made up of uniformly sized bars. Double bar graphs make it easy to compare two sets of data at once.
-
Double bar graphs make it easy to compare two sets of data at once. In our lives, there are events that are certain to occur, some that are impossible to occur, and still others that may or may not occur.
-
The situation, which may or may not occur, has a possibility to occur.
-
Probability is an area of mathematics that may be used to calculate the probability of an event occurring (in percentage terms). If you have ten likelihoods and want to determine the probability of one event occurring, you might say that the probability is 1 by 10 or the event has a 10 % 10% chance of occurring.
-
Events with multiple possibilities can have a probability ranging from 0 0 to 1. 1.
| CBSE Syllabus Class 7 | |
| CBSE Class 7 English Syllabus | CBSE Class 7 Math Syllabus |
| CBSE Class 7 Social Science Syllabus | CBSE Class 7 Science Syllabus |
Features of CBSE Class 7 Maths Notes Chapter 3
Here are some revision notes for the Class 7 Maths students on the Data Handling chapter. These will help them to fully comprehend and rewrite the chapter. Let's now examine the advantages of the revision notes.- We cover every significant subject from the perspective of the CBSE in our revision notes.
- You can spend an hour reviewing all the key points of a certain subject with these revision notes.
- These revision notes include multiple-choice questions in addition to FAQs, which will assist you in practicing an increasing number of questions. You become more proficient in that subject the more you practise it.
- We also offer you easily readable review notes for every chapter, which you can use to focus on whatever maths chapter you need to know since every topic has a distinct role in various test.
- Our top subject matter experts are available to help you write the best revision notes so you may perform to the best of your ability on the test.
- We offer notes with well-organized, simple diagrams, accurate captions, and content that will benefit you overall.
Related Links -
Benefits of CBSE Class 7 Maths Notes Chapter 3
Data Handling Revision Students who use our notes will be able to cover all the key ideas and details for the topics covered in Class 7 Maths Chapter 2 in a clear and concise manner, which will help them ace their test preparation.- You can download these notes in PDF format. As a result, students can review the chapter whenever they want to or wherever they are in case they need to review it before an exam.
- With these revision notes, you may review important ideas and topics more quickly and retain them better. This will result in a significant reduction in revision time and more time for students to spend answering questions.
CBSE Class 7 Maths Notes Chapter 3 FAQs
How can I get full marks in CBSE 7th maths?
What is the median in Class 7 notes?
What is raw data class 7?

