
Polynomials
Polynomials of Class 10
An algebraic expression f(x) of the form f(x) = a 0 + a 1 x + a 2 x 2 + ......+ anxn, where a 0 , a 1 , a 2 .......an are real numbers and all the index of x are non-negative integers is called polynomials in x and the highest Index n in called the degree of the polynomial, if
a n ≠ 0.
DEGREE OF A POLYNOMIAL:
Zero Degree Polynomial:
Any non-zero number is regarded as a polynomial of degree zero or zero degree polynomial. For example, f(x) = a, where a ≠ 0 is a zero degree polynomial, since we can write f(x) = a as f(x) = ax0.
(b) Constant Polynomial:
A polynomial of degree zero is called a constant polynomial. e.g. f(x) = 7.
(c) Linear Polynomial:
A polynomial of degree 1 is called a linear polynomial.
e.g. p(x) = 4x - 3 and f(t) = √3t + 5 are linear polynomials.
(d) Quadratic Polynomial:
A polynomial of degree 2 is called quadratic polynomial.
e.g. f(x) = 2x2 + 5x –3/5 and g(y) = 3y2 – 5 are quadratic polynomials with real coefficients.
VALUE OF A POLYNOMIAL:
If f(x) is a polynomial and α is any real number, then the real number obtained by replacing x by α in f(x) is called the value of f(x) at x = α and is denoted by f(α).
e.g. Value of p(x) = 5x 2 - 3x + 7at x = 1 will be
∴ p(1) = 5(1) 2 - 3(1) + 7
= 5 - 3 + 7 = 9
ZEROS OF A POLYNOMIAL:
A real number α is a zero of polynomial f(x) if f(α) = 0.
The zero of a linear polynomial ax + b is -b/a . i.e.
Geometrically zero of a polynomial is the point where the graph of the function cuts or touches x-axis.
When the graph of the polynomial does not meet the x-axis at all, the polynomial has no real zero.
GRAPH OF POLYNOMIALS:
In algebraic or in set theoretic language the graph of a polynomial f(x) is the collection (or set) of all points (x, y), where y = f(x). In geometrical or in graphical language the graph of a polynomial f(x) is a smooth free hand curve passing through points x 1 , y 1 ), (x 2 , y 2 ), (x 3 , y 3 ), ..... etc. where y 1 , y 2 , y 3 ,.... are the values of the polynomial f(x) at x 1 , x 2 , x 3 ,.... respectively.
In order to draw the graph of a polynomial f(x), follow the following algorithm.
ALGORITHM:
Step I: Find the values y 1 , y 2, ...... yn of polynomial f(x) on different points x 1 , x 2 , ....... xn………… and prepare a table that gives values of y or f(x) for various values of x.
|
x: |
x 1 x 2 … x n x n+1 … |
|
y = f(x) |
y 1 = f(x1) y 2 = f(x 2 ) … Y n = f(x n ) y n+1 = f(x n+1 ) … |
Step II: Plot that points (x 1 , y 1 ), (x 2 , y 2 ), (x 3 , y 3 ),.....(x n , y n ).... on rectangular co-ordinate system. In plotting these points use different scales on the X and Y axes.
Step III: Draw a free hand smooth curve passing through points plotted in step 2 to get the graph of the polynomial f(x).
Graph of a Linear Polynomial:
Consider a linear polynomial f(x) = ax + b, a ≠ 0 Graph of y = ax + b is a straight line. That in why f(x) = ax + b) is called a linear polynomial. Since two points determine a straight line, so only two points need to plotted to draw the line y = ax + b. The line represented by y = ax + b crosses the X-axis at exactly one point, namely
 .
.
1. Draw the graph of the polynomial f(x) = 2x - 5. Also, find the coordinates of the point where it crosses X-axis.
Sol. Let y = 2x - 5.
The following table list the values of y corresponding to different values of x.
|
x |
1 |
4 |
|
y |
-3 |
3 |
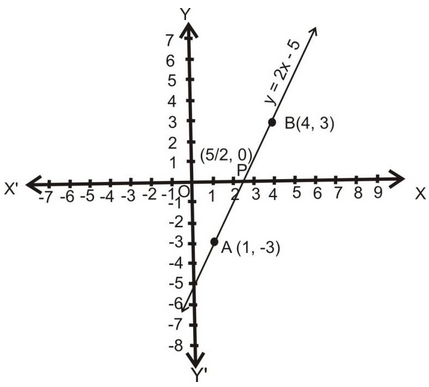
The points A (1, - 3) and B (4, 3) are plotted on the graph paper on a suitable scale. A line is drawn passing through these points to obtain the graphs of the given polynomial.
(b) Graph of a Quadratic Polynomial :
Let a,b,c be real numbers and a ≠ 0. Then f(x) = ax2 + bx + c is known as a quadratic polynomial in x. Graph of the quadratic polynomial i.e. he curve whose equation is y = ax2 + bx + c, a ≠ 0 Graph of a quadratic polynomial is always a parabola.
Let y = ax 2 + bx + c, where a ≠ 0
⇒ 4ay = 4a 2 x 2 + 4abx + 4ac
⇒ 4ay = 4a 2 x 2 + 4abx + b 2 – b 2 + 4ac
⇒ 4ay = (2ax + b) 2 – (b 2 - 4ac)
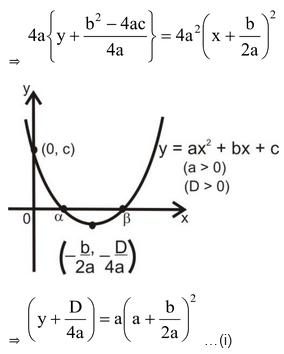
⇒ 4ay + (b2 – 4ac) = (2ax + b) 2 ⇒ 4ay + (b 2 – 4ac) = 4a 2 (x + b/2a) 2
where D = b 2 - 4ac is the discriminate of the quadratic equation.
Remarks:
Shifting the origin at
 , we have X = x -
 and Y = y -

Substituting these values in (i), we obtain
Y = aX 2 ....(ii)
which is the standard equation of parabola
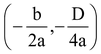
Clearly, this is the equation of a parabola having its vertex at
.
The parabola opens upwards or downwards according as a > 0 or a < 0.
SIGNS OF COEFFICIENTS OF A QUADRATIC POLYNOMIAL:
The graphs of y = ax 2 + bx + c are given in figure. Identify the signs of a, b and c in each of the following:
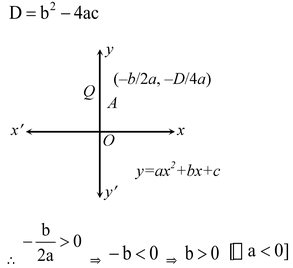
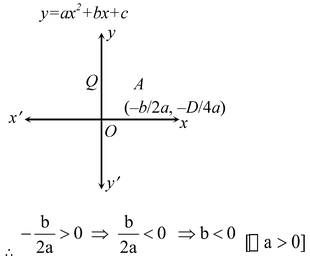
(i) We observe that y = ax
2
+ bx + c represents a parabola opening downwards. Therefore, a < 0. We observe that the turning point
of the parabola is in first quadrant where
Parabola y = ax 2 + bx + c cuts y-axis at Q. On y-axis, we have x = 0.
Putting x = 0 in y = ax 2 + bx + c we get y = c.
So, the coordinates of Q are (0, c). As Q lies on the positive direction of y-axis. Therefore, c > 0.
Hence, a < 0, b > 0 and c > 0.
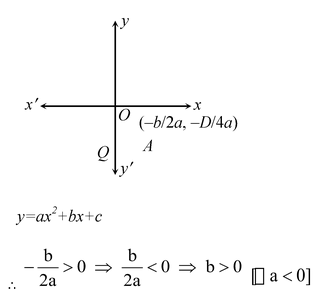
(ii) We find that y = ax 2 + bx + c represents a parabola opening upwards. Therefore, a > 0 The turning point of the parabola is in fourth quadrant.
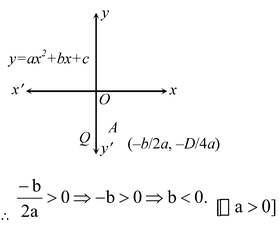
Parabola y = ax 2 + bx + c cuts y-axis at Q and y-axis. We have x = 0. Therefore, on putting x = 0 in y = ax 2 + bx + c we get y = c.
So, the coordinates of Q are (0, c). As Q lies on negative y-axis. Therefore, c < 0.
Hence, a > 0, b < 0 and c < 0.
(iii) Clearly, y = ax 2 + bx + c represents a parabola opening upwards.
Therefore, a > 0. The turning point of the parabola lies on positive direction of x-axis.
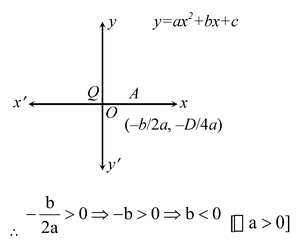
The parabola y = ax
2
+ bx + c cuts y-axis at Q which lies on positive y-axis. Putting
x = 0 in y = ax
2
+ bx + c we get y = c. So, the coordinates of Q are (0, c). Clearly, Q lies on OY.
∴ c > 0.
Hence, a > 0, b < 0, and c > 0.
(iv) The parabola y = ax 2 + bx + c opens downwards. Therefore, a < 0.
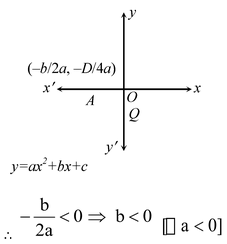
The turning point
of the parabola is on negative x-axis,
Parabola y = ax 2 + bx + c cuts y-axis at Q (0, c) which lies on negative y-axis. Therefore, c < 0.
Hence, a < 0, b < 0and c < 0.
(v) We notice that the parabola y = ax 2 + bx + c opens upwards. Therefore, a > 0.
Turning point
of the parabola lies in the first quadrant.
As Q (0, c) lies on positive y-axis. Therefore, c > 0.
Hence, a >0, b < 0 and c > 0.
(vi) Clearly, a < 0
Turning point
of the parabola lies in the fourth quadrant.
As Q (0, c) lies on negative y-axis. Therefore, c < 0.
Hence, a < 0, b> 0 and c < 0.