
NCERT Solutions for Class 6 Maths Chapter 9 Data Handling
NCERT Solutions for Class 6 Maths Chapter 9 is given in an easy to understand and simplified way for class 6 students. Check out the detailed NCERT solutions for Class 6 Maths chapter 9 on this page

NCERT Solutions for Class 6 Maths Chapter 9
NCERT Solutions for Class 6 Maths Chapter 9: NCERT Solutions for Class 6 Maths Chapter 9, Data Handling, is a crucial study resource for practicing for exams. The topics covered in Class 6 Mathematics are fundamental and will be built upon in higher classes. Therefore, it is important for students to grasp the basic concepts and problem-solving methods presented in these NCERT Solutions for Class 6 Maths Chapter 9 to enhance their learning skills.NCERT Solutions for Class 6 Maths Chapter 9 PDF Download
NCERT Solutions for Class 6 Maths Chapter 9 Overview
NCERT Solutions for Class 6 Maths Chapter 9 can be consulted for students seeking a helpful reference book for exam preparation. It provides accurate and comprehensive answers to exercise questions, aiding candidates in improving their preparations and, consequently, their final grades. Access the free NCERT Solutions for Class 6 Maths Chapter 9 and begin preparing today. You can also enrol online for NCERT Solutions Class 6 Science tuition on PhysicsWallah to achieve higher scores in your examination.NCERT Solutions for Class 6 Maths Chapter 9 Data Handling
NCERT Solutions for Class 6 Maths Chapter 9 are a useful resource for Class 6 students. They play a crucial role in introducing mathematical concepts in a way that is easy to understand. The solutions and explanations simplify complex topics, making it more accessible for Class 6 students to understand the subject. Through the use of these materials, students can enhance their understanding of NCERT concepts. These solutions act as a beneficial support for Class 6 students, enabling them to succeed in their studies and foster a true understanding of Data Handling. Keep reading for more details: Exercise 9.1 Page No: 192 1. In a Mathematics test, the following marks were obtained by 40 students. Arrange these marks in a table using tally marks.| 8 | 1 | 3 | 7 | 6 | 5 | 5 | 4 | 4 | 2 |
| 4 | 9 | 5 | 3 | 7 | 1 | 6 | 5 | 2 | 7 |
| 7 | 3 | 8 | 4 | 2 | 8 | 9 | 5 | 8 | 6 |
| 7 | 4 | 5 | 6 | 9 | 6 | 4 | 4 | 6 | 6 |
| Marks | Tally Marks | Number of Students | |
| 1 | || | 2 | |
| 2 | ||| | 3 | |
| 3 | ||| | 3 | |
| 4 | || | 7 | |
| 5 | | | 6 | |
| 6 | || | 7 | |
| 7 | 5 | ||
| 8 | |||| | 4 | |
| 9 | ||| | 3 | |
| Sweets | Tally Marks | Number of Students |
| Ladoo | | | 11 |
| Barfi | ||| | 3 |
| Jalebi | || | 7 |
| Rasgulla | |||| | 9 |
| 30 |
| 1 | 3 | 5 | 6 | 6 | 3 | 5 | 4 | 1 | 6 |
| 2 | 5 | 3 | 4 | 6 | 1 | 5 | 5 | 6 | 1 |
| 1 | 2 | 2 | 3 | 5 | 2 | 4 | 5 | 5 | 6 |
| 5 | 1 | 6 | 2 | 3 | 5 | 2 | 4 | 1 | 5 |
| Numbers | Tally Marks | Number of times |
| 1 | || | 7 |
| 2 | | | 6 |
| 3 | 5 | |
| 4 | |||| | 4 |
| 5 | | | 11 |
| 6 | || | 7 |
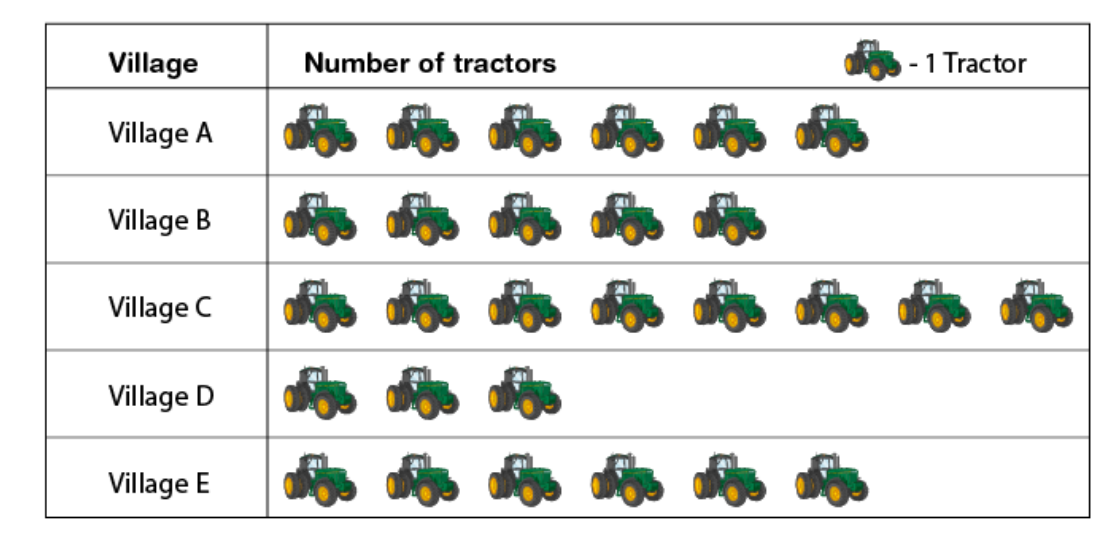 Observe the pictograph and answer the following questions.
(i) Which village has the minimum number of tractors?
(ii) Which village has the maximum number of tractors?
(iii) How many more tractors village C has as compared to village B?
(iv) What is the total number of tractors in all the five villages?
Solutions:
(i)
Village D has the minimum number of tractors.
(ii)
Village C has the maximum number of tractors.
(iii)
Village B has 5 tractors
Village C has 8 tractors
= 8 – 5
= 3 tractors
Village C has 3 more tractors as compared to village B
(iv)
Total number of tractors in all the villages = 6 + 5 + 8 + 3 + 6 = 28 tractors
5. The number of girl students in each class of a co-educational middle school is depicted by the pictograph:
Observe the pictograph and answer the following questions.
(i) Which village has the minimum number of tractors?
(ii) Which village has the maximum number of tractors?
(iii) How many more tractors village C has as compared to village B?
(iv) What is the total number of tractors in all the five villages?
Solutions:
(i)
Village D has the minimum number of tractors.
(ii)
Village C has the maximum number of tractors.
(iii)
Village B has 5 tractors
Village C has 8 tractors
= 8 – 5
= 3 tractors
Village C has 3 more tractors as compared to village B
(iv)
Total number of tractors in all the villages = 6 + 5 + 8 + 3 + 6 = 28 tractors
5. The number of girl students in each class of a co-educational middle school is depicted by the pictograph:
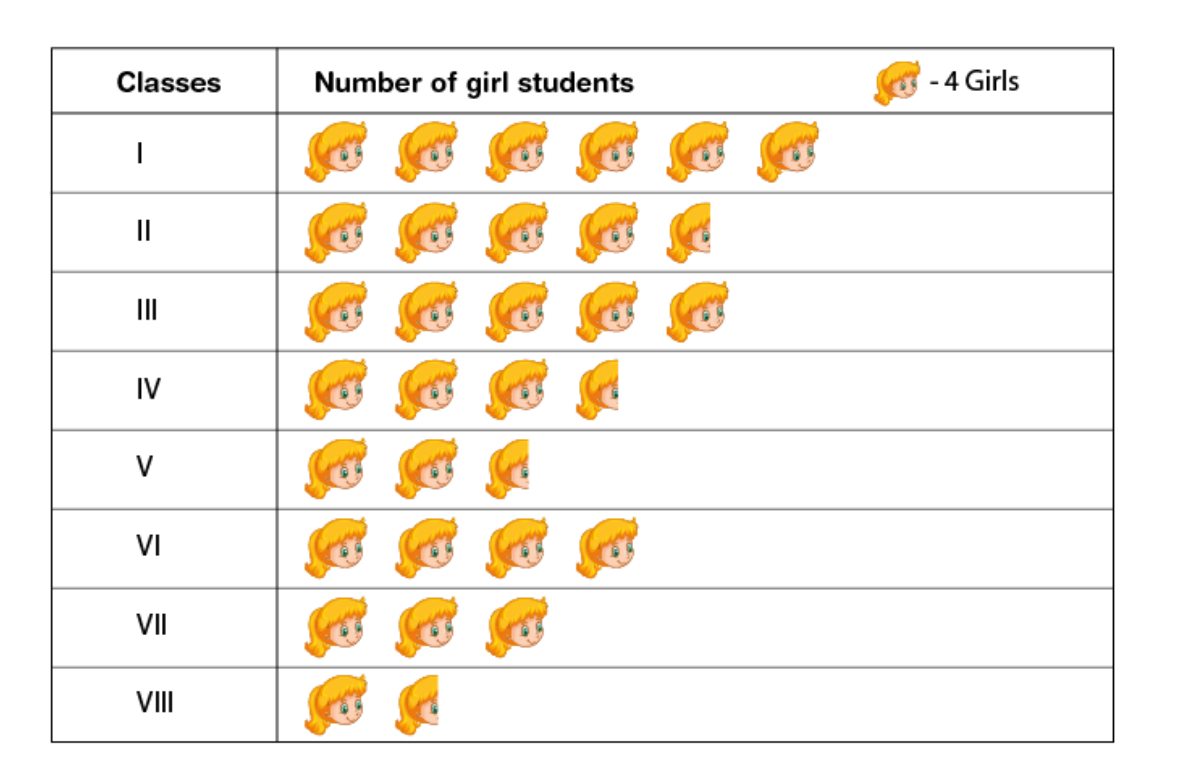 Observe this pictograph and answer the following questions:
(a) Which class has the minimum number of girl students?
(b) Is the number of girls in Class VI less than the number of girls in Class V?
(c) How many girls are there in Class VII?
Solutions:
By observing the above table, there are 24, 18, 20, 14, 10, 16, 12 and 6 girls, respectively from Class I to VIII
(a)
Class VIII has only 6 girls. Therefore, the minimum number of girl students are in Class VIII
(b)
No. Class V has 10 girl students
Class VI has 16 girl students
Hence, the number of girls in Class VI is more than the number of girls in Class V
(c)
The number of girls in Class VII is 12
6. The sale of electric bulbs on different days of a week is shown below:
Observe this pictograph and answer the following questions:
(a) Which class has the minimum number of girl students?
(b) Is the number of girls in Class VI less than the number of girls in Class V?
(c) How many girls are there in Class VII?
Solutions:
By observing the above table, there are 24, 18, 20, 14, 10, 16, 12 and 6 girls, respectively from Class I to VIII
(a)
Class VIII has only 6 girls. Therefore, the minimum number of girl students are in Class VIII
(b)
No. Class V has 10 girl students
Class VI has 16 girl students
Hence, the number of girls in Class VI is more than the number of girls in Class V
(c)
The number of girls in Class VII is 12
6. The sale of electric bulbs on different days of a week is shown below:
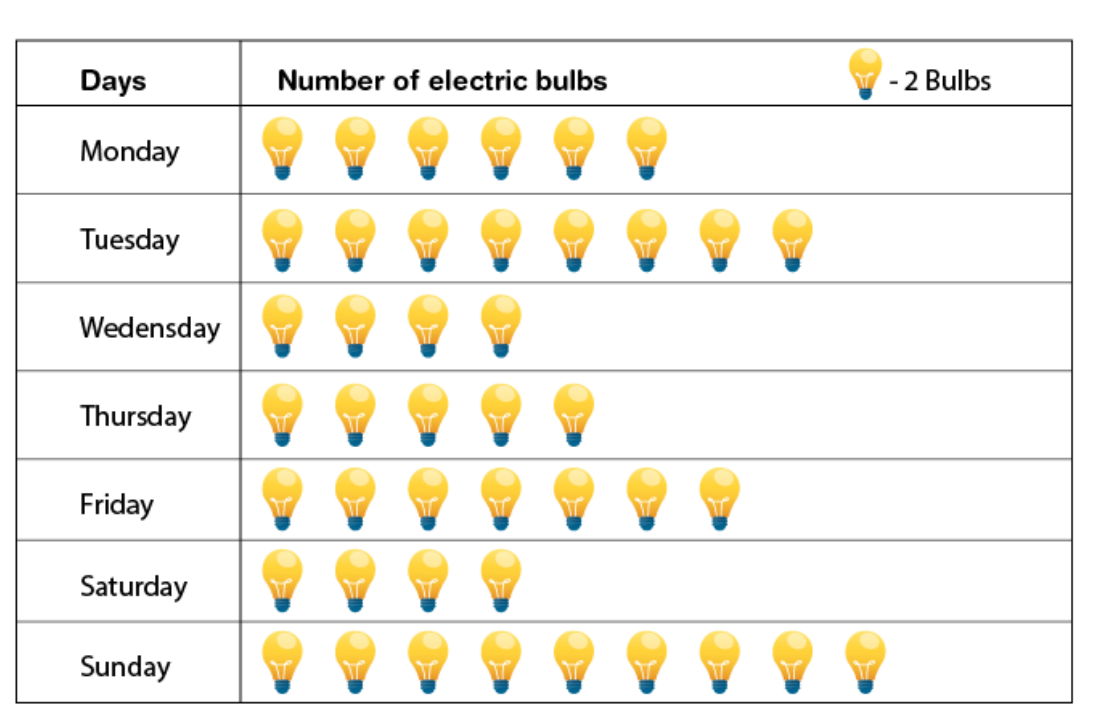 Observe the pictograph and answer the following questions:
(a) How many bulbs were sold on Friday?
(b) On which day were the maximum number of bulbs sold?
(c) On which of the days same number of bulbs were sold?
(d) On which of the days minimum number of bulbs were sold?
(e) If one big carton can hold 9 bulbs. How many cartons were needed in the given week?
Solutions:
(a)
Number of bulbs sold on Friday is 14 bulbs.
(b)
On Sunday the highest number of bulbs, i.e., 18, is sold. Thus, the maximum number of bulbs were sold on Sunday.
(c)
On Wednesday and Saturday, 8 bulbs are sold. Hence, an equal number of bulbs were sold on Wednesday and Saturday.
(d)
Minimum number of bulbs were sold on Wednesday and Saturday, i.e., 8 bulbs.
(e)
Total number of bulbs sold in a week = 12 + 16 + 8 + 10 + 14 + 8 + 18 = 86
7. In a village six fruit merchants sold the following number of fruit baskets in a particular season:
Observe the pictograph and answer the following questions:
(a) How many bulbs were sold on Friday?
(b) On which day were the maximum number of bulbs sold?
(c) On which of the days same number of bulbs were sold?
(d) On which of the days minimum number of bulbs were sold?
(e) If one big carton can hold 9 bulbs. How many cartons were needed in the given week?
Solutions:
(a)
Number of bulbs sold on Friday is 14 bulbs.
(b)
On Sunday the highest number of bulbs, i.e., 18, is sold. Thus, the maximum number of bulbs were sold on Sunday.
(c)
On Wednesday and Saturday, 8 bulbs are sold. Hence, an equal number of bulbs were sold on Wednesday and Saturday.
(d)
Minimum number of bulbs were sold on Wednesday and Saturday, i.e., 8 bulbs.
(e)
Total number of bulbs sold in a week = 12 + 16 + 8 + 10 + 14 + 8 + 18 = 86
7. In a village six fruit merchants sold the following number of fruit baskets in a particular season:
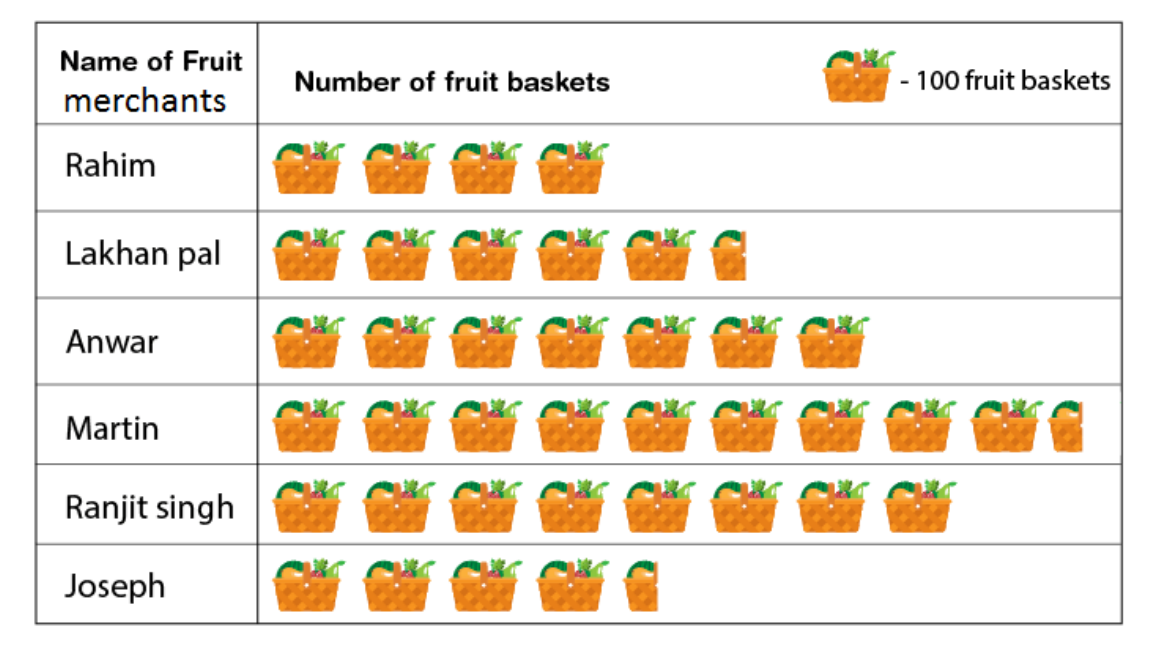 Observe this pictograph and answer the following questions:
(a) Which merchant sold the maximum number of baskets?
(b) How many fruit baskets were sold by Anwar?
(c) The merchants who have sold 600 or more number of baskets are planning to buy a godown for the next season. Can you name them?
Solutions:
From the pictograph, the number of fruit baskets sold by Rahim, Lakhanpal, Anwar, Martin, Ranjit Singh and Joseph is 400, 550, 700, 950, 800 and 450, respectively
(a)
Martin sold the maximum number of fruit baskets, i.e., 950
(b)
Anwar sold 700 fruit baskets
(c)
Anwar, Martin and Ranjit Singh are the merchants who sold more than 600 fruit baskets. Hence, these are the merchants who are planning to buy a godown for the next season.
Observe this pictograph and answer the following questions:
(a) Which merchant sold the maximum number of baskets?
(b) How many fruit baskets were sold by Anwar?
(c) The merchants who have sold 600 or more number of baskets are planning to buy a godown for the next season. Can you name them?
Solutions:
From the pictograph, the number of fruit baskets sold by Rahim, Lakhanpal, Anwar, Martin, Ranjit Singh and Joseph is 400, 550, 700, 950, 800 and 450, respectively
(a)
Martin sold the maximum number of fruit baskets, i.e., 950
(b)
Anwar sold 700 fruit baskets
(c)
Anwar, Martin and Ranjit Singh are the merchants who sold more than 600 fruit baskets. Hence, these are the merchants who are planning to buy a godown for the next season.
CBSE Board Exam Centre List 2024
Exercise 9.2 Page No: 196 1. Total number of animals in five villages are as follows: Village A : 80 Village B : 120 Village C : 90 Village D : 40 Village E : 60 Prepare a pictograph of these animals using one symbol to represent 10 animals and answer the following questions:
(a) How many symbols represent animals of village E?
(b) Which village has the maximum number of animals?
(c) Which village has more animals: village A or village C?
Solutions:
We can draw the pictograph for the given data as shown below
to represent 10 animals and answer the following questions:
(a) How many symbols represent animals of village E?
(b) Which village has the maximum number of animals?
(c) Which village has more animals: village A or village C?
Solutions:
We can draw the pictograph for the given data as shown below
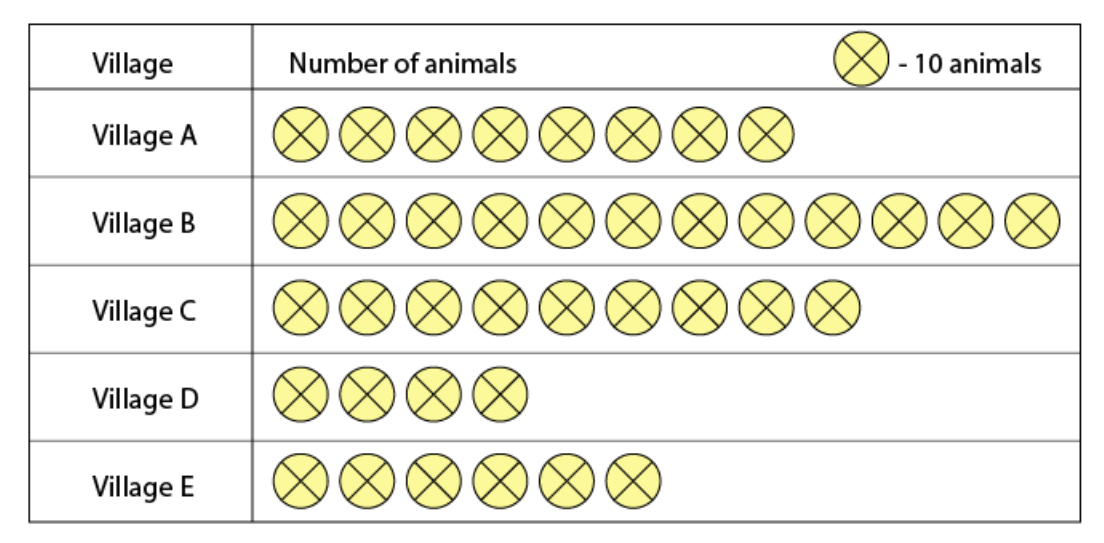 (a)
There are 60 animals in village E. So 6 symbols represent animals of village E
(b)
Village B has 120 animals which is the maximum number among these villages.
(c)
Village A has 80 animals, and village C has 90 animals. Clearly, village C has more animals than village A
2. Total number of students of a school in different years is shown in the following table
(a)
There are 60 animals in village E. So 6 symbols represent animals of village E
(b)
Village B has 120 animals which is the maximum number among these villages.
(c)
Village A has 80 animals, and village C has 90 animals. Clearly, village C has more animals than village A
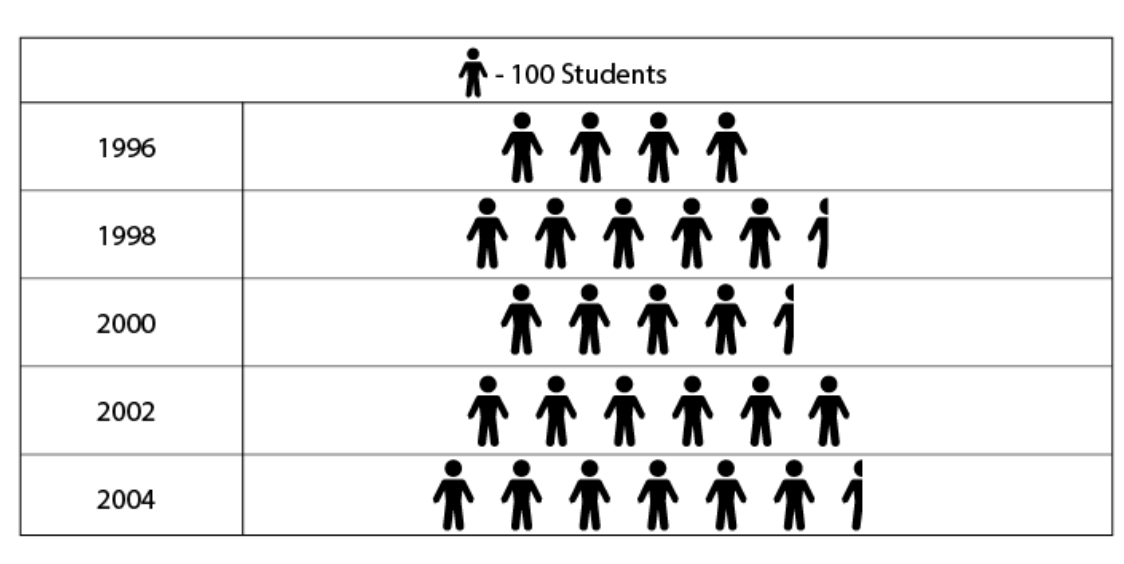
2. Total number of students of a school in different years is shown in the following table
| Years | Number of Students |
| 1996 | 400 |
| 1998 | 535 |
| 2000 | 472 |
| 2002 | 600 |
| 2004 | 623 |
 to represent 100 students and answer the following questions:
(a) How many symbols represent total number of students in the year 2002?
(b) How many symbols represent total number of students for the year 1998?
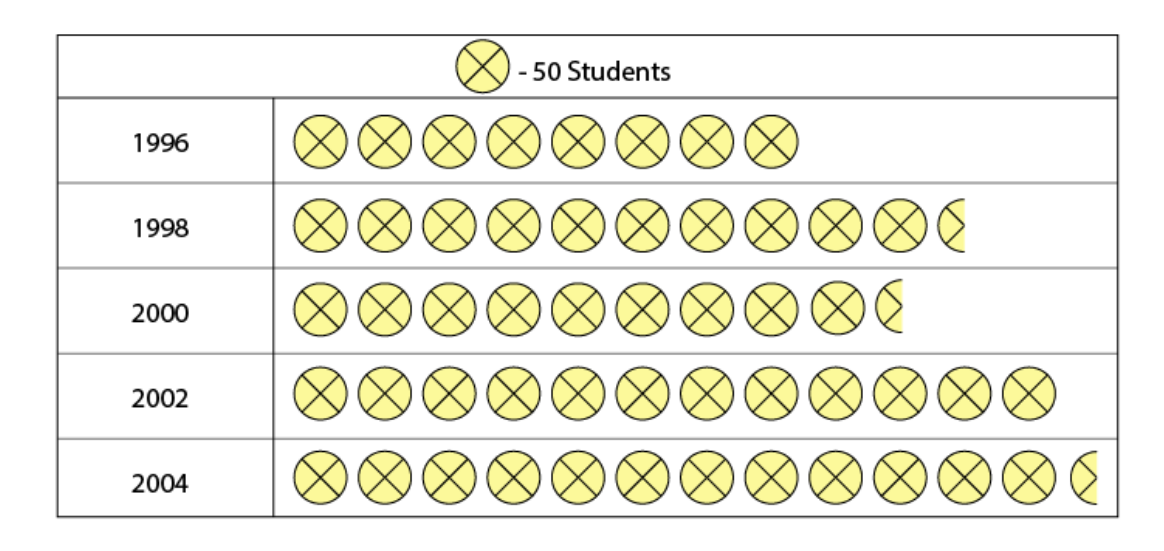
1. Prepare another pictograph of students using any other symbol each representing 50 students. Which pictograph do you find more informative?
Solutions:
to represent 100 students and answer the following questions:
(a) How many symbols represent total number of students in the year 2002?
(b) How many symbols represent total number of students for the year 1998?
1. Prepare another pictograph of students using any other symbol each representing 50 students. Which pictograph do you find more informative?
Solutions:
A
(a) Total number of students in the year 2002 represents 6 symbols (b) Total number of students in the year 1998 represents 5 complete symbols and 1 incomplete symbolB. Second is more informative.
 Exercise 9.3 Page No: 198
1. The bar graph given alongside shows the amount of wheat purchased by government during the year 1998-2002.
Read the bar graph and write down your observations. In which year was
(a) the wheat production maximum?
(b) the wheat production minimum?
Exercise 9.3 Page No: 198
1. The bar graph given alongside shows the amount of wheat purchased by government during the year 1998-2002.
Read the bar graph and write down your observations. In which year was
(a) the wheat production maximum?
(b) the wheat production minimum?
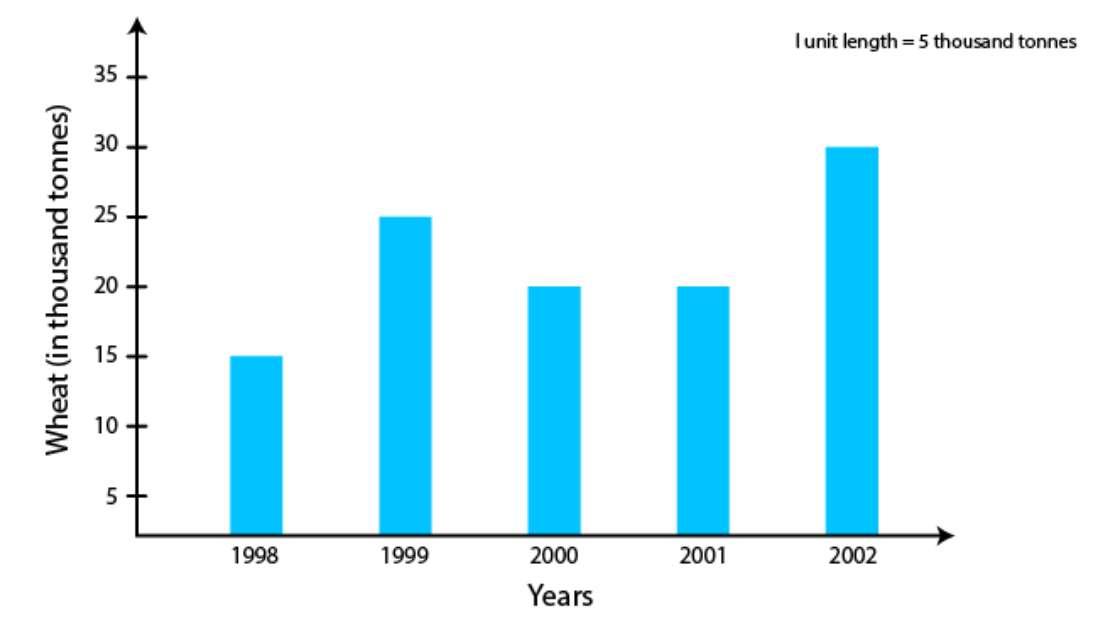 Solutions:
(a)
The wheat production was maximum in the year 2002
(b)
The wheat production was minimum in the year 1998
2. Observe this bar graph which is showing the sale of shirts in a ready made shop from Monday to Saturday
Solutions:
(a)
The wheat production was maximum in the year 2002
(b)
The wheat production was minimum in the year 1998
2. Observe this bar graph which is showing the sale of shirts in a ready made shop from Monday to Saturday
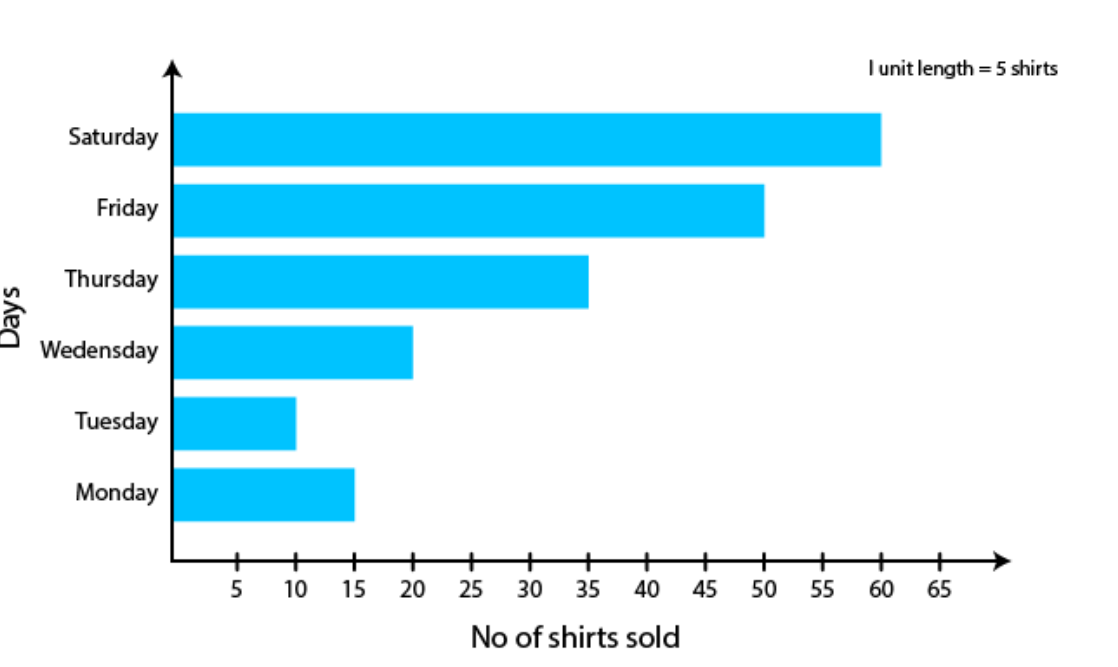 Now answer the following questions:
(a) What information does the above bar graph give?
(b) What is the scale chosen on the horizontal line representing number of shirts?
(c) On which day were the maximum number of shirts sold? How many shirts were sold on that day?
(d) On which day were the minimum number of shirts sold?
(e) How many shirts were sold on Thursday?
Solutions:
(a)
The above bar graph shows the number of shirts sold from Monday to Saturday.
(b)
1 unit length = 5 shirts is the scale on the horizontal line representing the number of shirts.
(c)
On Saturday maximum number of shirts, i.e., 60 shirts, were sold.
(d)
On Tuesday minimum number of shirts, i.e., 10 shirts, were sold.
(e)
35 shirts were sold on Thursday
Now answer the following questions:
(a) What information does the above bar graph give?
(b) What is the scale chosen on the horizontal line representing number of shirts?
(c) On which day were the maximum number of shirts sold? How many shirts were sold on that day?
(d) On which day were the minimum number of shirts sold?
(e) How many shirts were sold on Thursday?
Solutions:
(a)
The above bar graph shows the number of shirts sold from Monday to Saturday.
(b)
1 unit length = 5 shirts is the scale on the horizontal line representing the number of shirts.
(c)
On Saturday maximum number of shirts, i.e., 60 shirts, were sold.
(d)
On Tuesday minimum number of shirts, i.e., 10 shirts, were sold.
(e)
35 shirts were sold on Thursday
| CBSE Syllabus Class 6 | |
| CBSE Class 6 Science Syllabus | CBSE Class 6 Maths Syllabus |
| CBSE Class 6 Social Science Syllabus | CBSE Class 6 English Syllabus |
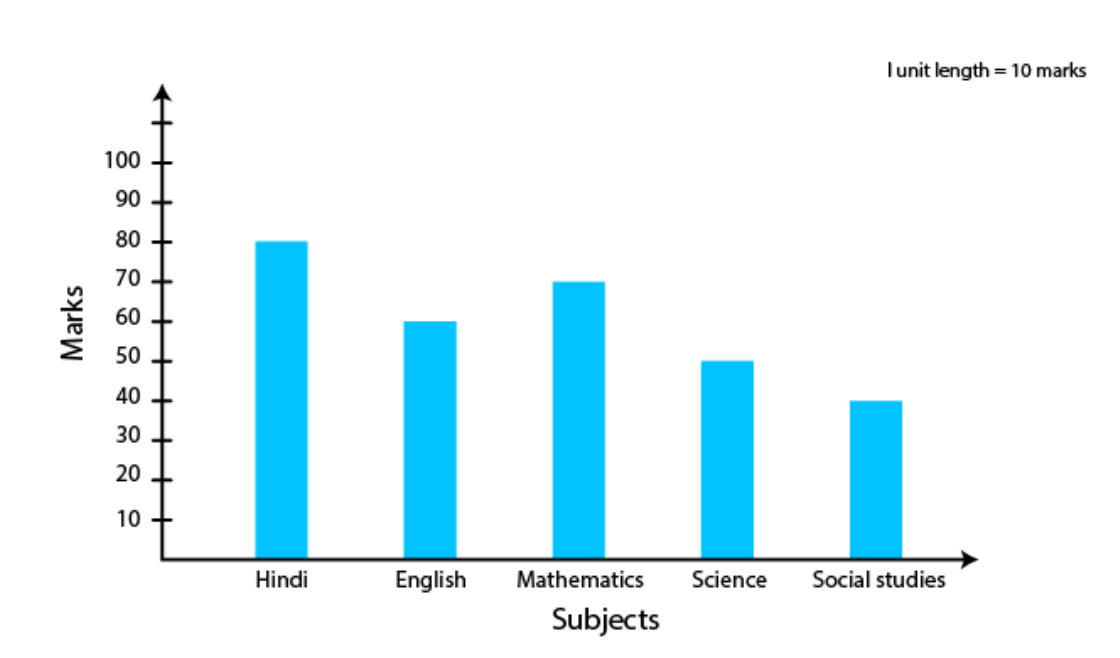 (a) What information does the bar graph give?
(b) Name the subject in which Aziz scored maximum marks.
(c) Name the subject in which he has scored minimum marks.
(d) State the name of the subjects and marks obtained in each of them.
Solutions:
(a)
The bar graph shows the marks scored by Aziz in different subjects.
(b)
Aziz scored maximum marks in Hindi, i.e., 80 marks
(c)
Aziz scored minimum marks in Social Studies, i.e., 40 marks
(d)
Hindi – 80 marks English – 60 marks Mathematics – 70 marks
Science – 50 marks Social Studies – 40 marks
Exercise 9.4 Page No 202
1. A survey of 120 school students was done to find which activity they prefer to do in their free time.
(a) What information does the bar graph give?
(b) Name the subject in which Aziz scored maximum marks.
(c) Name the subject in which he has scored minimum marks.
(d) State the name of the subjects and marks obtained in each of them.
Solutions:
(a)
The bar graph shows the marks scored by Aziz in different subjects.
(b)
Aziz scored maximum marks in Hindi, i.e., 80 marks
(c)
Aziz scored minimum marks in Social Studies, i.e., 40 marks
(d)
Hindi – 80 marks English – 60 marks Mathematics – 70 marks
Science – 50 marks Social Studies – 40 marks
Exercise 9.4 Page No 202
1. A survey of 120 school students was done to find which activity they prefer to do in their free time.
| Preferred activity | Number of Students |
| Playing | 45 |
| Reading story books | 30 |
| Watching T.V | 20 |
| Listening to music | 10 |
| Painting | 15 |
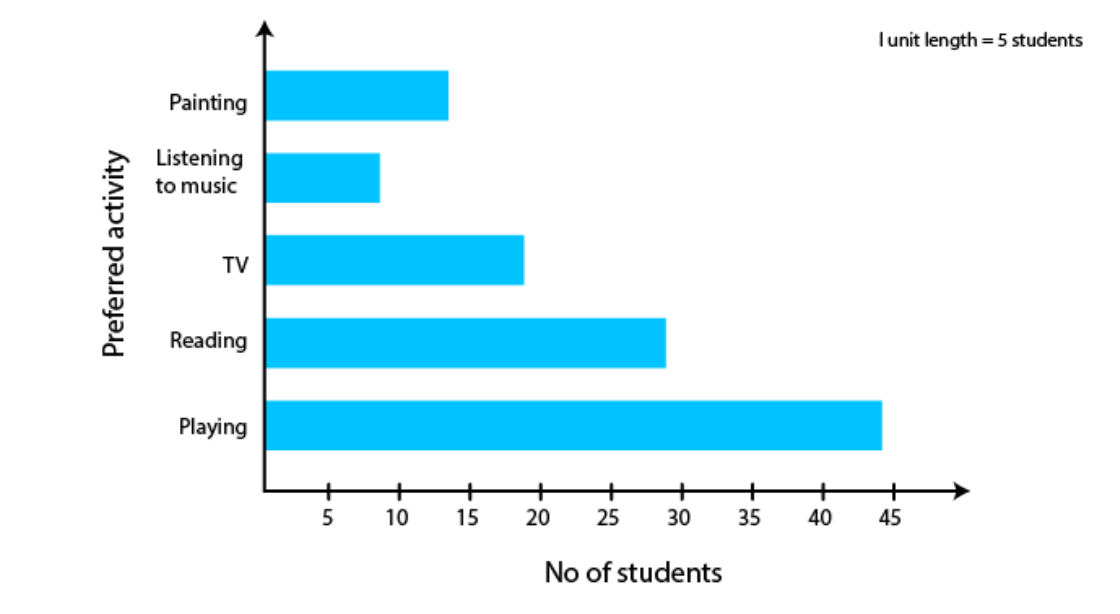 Reading storybooks is the activity preferred by most of the students other than playing
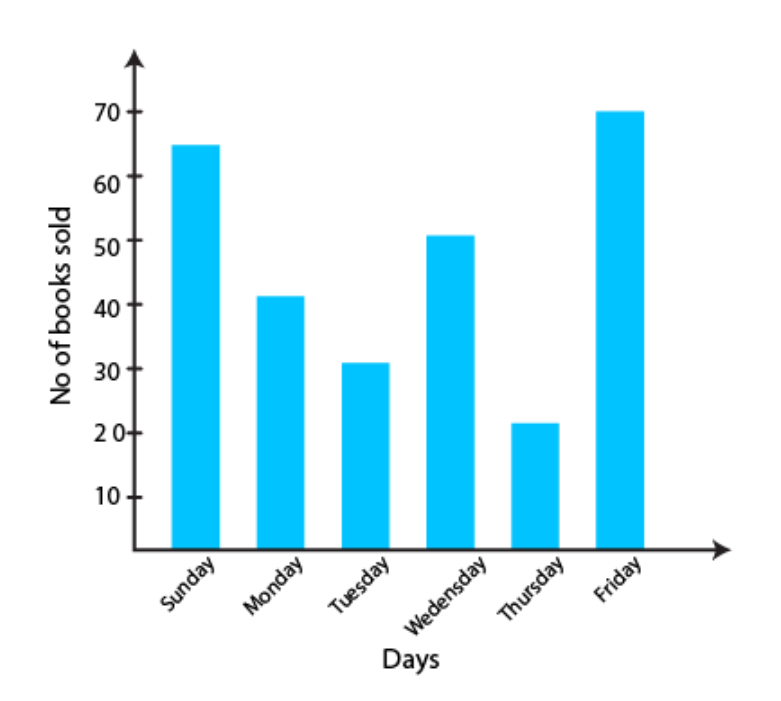
2. The number of Mathematics books sold by a shopkeeper on six consecutive days is shown below:
Reading storybooks is the activity preferred by most of the students other than playing
2. The number of Mathematics books sold by a shopkeeper on six consecutive days is shown below:
| Days | Sunday | Monday | Tuesday | Wednesday | Thursday | Friday |
| Number of books sold | 65 | 40 | 30 | 50 | 20 | 70 |
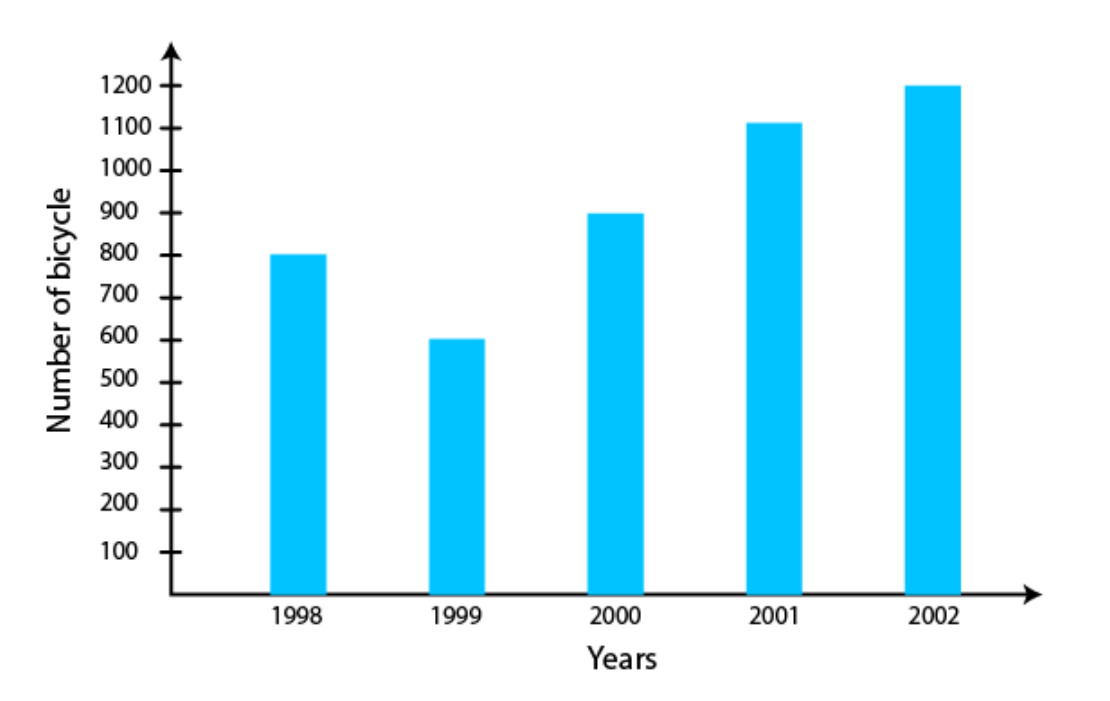
 3. Following table shows the number of bicycles manufactured in a factory during the years 1998 to 2002. Illustrate this data using a bar graph. Choose a scale of your choice
| Year | Number of bicycles manufactured |
| 1998 | 800 |
| 1999 | 600 |
| 2000 | 900 |
| 2001 | 1100 |
| 2002 | 1200 |
 (a)
In the year 2002, the maximum number of bicycles were manufactured, i.e., 1200 bicycles
(b)
In the year 1999, the minimum number of bicycles were manufactured, i.e., 600 bicycles
(a)
In the year 2002, the maximum number of bicycles were manufactured, i.e., 1200 bicycles
(b)
In the year 1999, the minimum number of bicycles were manufactured, i.e., 600 bicycles
| Related Links |
| Age group (in years) | 1-14 | 15-29 | 30-44 | 45-59 | 60-74 | 75 and above |
| Number of persons | 2 lakhs | 1 lakh 60 thousand | 1 lakh 20 thousand | 1 lakh 20 thousand | 80 thousand | 40 thousand |
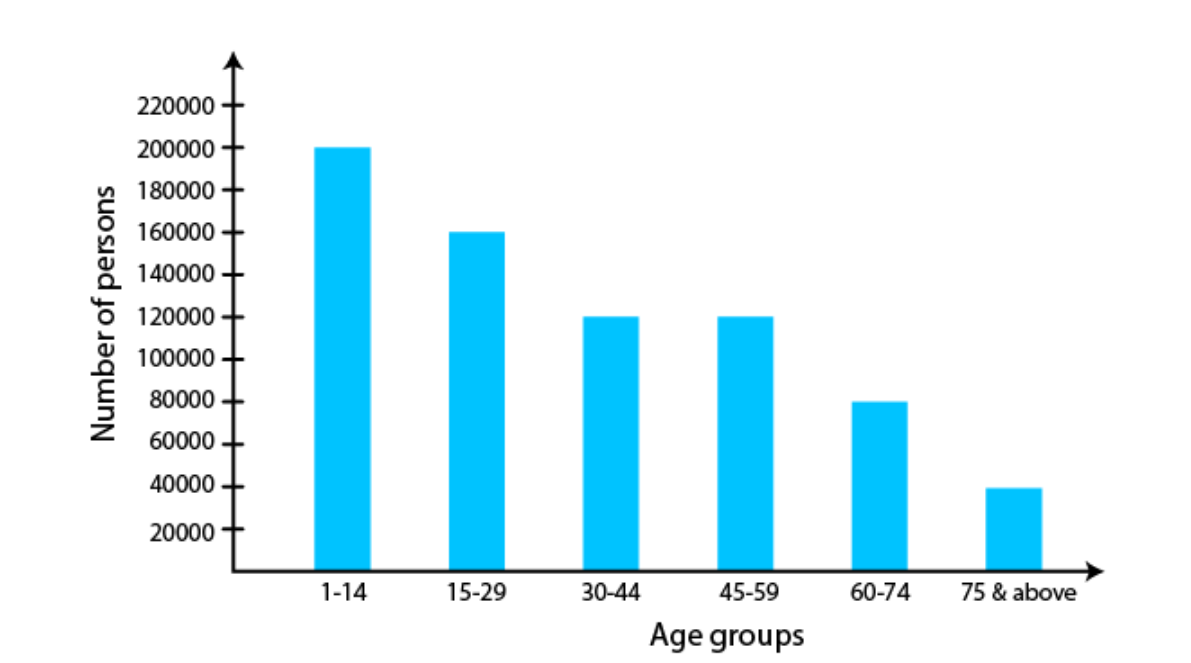 (a)
The two age groups which have same population are 30-44 and 45-59
(b)
Senior citizens are the persons between the age group either from 60-74 or from 75 above. Therefore
Number of senior citizens in the town = 80000 + 40000
= 1 lakh 20 thousand
Hence, the number of senior citizens in the town is 1 lakh 20 thousand.
(a)
The two age groups which have same population are 30-44 and 45-59
(b)
Senior citizens are the persons between the age group either from 60-74 or from 75 above. Therefore
Number of senior citizens in the town = 80000 + 40000
= 1 lakh 20 thousand
Hence, the number of senior citizens in the town is 1 lakh 20 thousand.
NCERT Solutions for Class 6 Maths Chapter 9 FAQs
What is Data handling for Class 6th?
Data handling for Class 6 involves teaching students how to collect, organize, and interpret information using methods such as bar graphs and tables.
What is included in Data Handling Class 6 Maths Chapter 9?
Data Handling Class 6 Maths Chapter 9 covers topics such as collecting data, organizing it using tally marks, and representing it graphically through bar graphs and pictographs.
How many types of data handling are there?
There are two main types of data handling: qualitative, dealing with non-numeric information, and quantitative, involving numerical data.
How do you arrange the given raw data?
Raw data is arranged in either ascending or descending order to simplify analysis, aiding in the identification of patterns and trends.
How can data be organized as discussed in Chapter 9 of NCERT Solutions for Class 6 Maths?
In Chapter 9 of NCERT Solutions for Class 6 Maths, data can be organized using tally marks, tables, and graphs, providing a clear and concise representation of information.

🔥 Trending Blogs
Talk to a counsellorHave doubts? Our support team will be happy to assist you!

Join 15 Million students on the app today!

Free Learning Resources
PW Books
Notes (Class 10-12)
PW Study Materials
Notes (Class 6-9)
Ncert Solutions
Govt Exams
Our Other Websites
Class 6th to 12th Online Courses
Govt Job Exams Courses
UPSC Coaching
Defence Exam Coaching
Gate Exam Coaching
Other Exams
Know about Physics Wallah
Physics Wallah is an Indian edtech platform that provides accessible & comprehensive learning experiences to students from Class 6th to postgraduate level. We also provide extensive NCERT solutions, sample paper, NEET, JEE Mains, BITSAT previous year papers & more such resources to students. Physics Wallah also caters to over 3.5 million registered students and over 78 lakh+ Youtube subscribers with 4.8 rating on its app.
We Stand Out because
We provide students with intensive courses with India’s qualified & experienced faculties & mentors. PW strives to make the learning experience comprehensive and accessible for students of all sections of society. We believe in empowering every single student who couldn't dream of a good career in engineering and medical field earlier.
Our Key Focus Areas
Physics Wallah's main focus is to make the learning experience as economical as possible for all students. With our affordable courses like Lakshya, Udaan and Arjuna and many others, we have been able to provide a platform for lakhs of aspirants. From providing Chemistry, Maths, Physics formula to giving e-books of eminent authors like RD Sharma, RS Aggarwal and Lakhmir Singh, PW focuses on every single student's need for preparation.
What Makes Us Different
Physics Wallah strives to develop a comprehensive pedagogical structure for students, where they get a state-of-the-art learning experience with study material and resources. Apart from catering students preparing for JEE Mains and NEET, PW also provides study material for each state board like Uttar Pradesh, Bihar, and others
Copyright © 2026 Physicswallah Limited All rights reserved.