

Normal Distribution Formula, Definition, Solved Examples
Normal Distribution Formula: The normal distribution, also known as the bell curve or Gaussian distribution, stands as one of the most crucial continuous probability distributions within the field of probability and statistics. In realms such as physical science and economics, a wide array of significant random variables align closely or precisely with the characteristics of the normal distribution. Moreover, the normal distribution formula serves as a tool for approximating various other probability distributions.
Random variables conforming to the normal distribution encompass values capable of assuming any known value within a specified range.
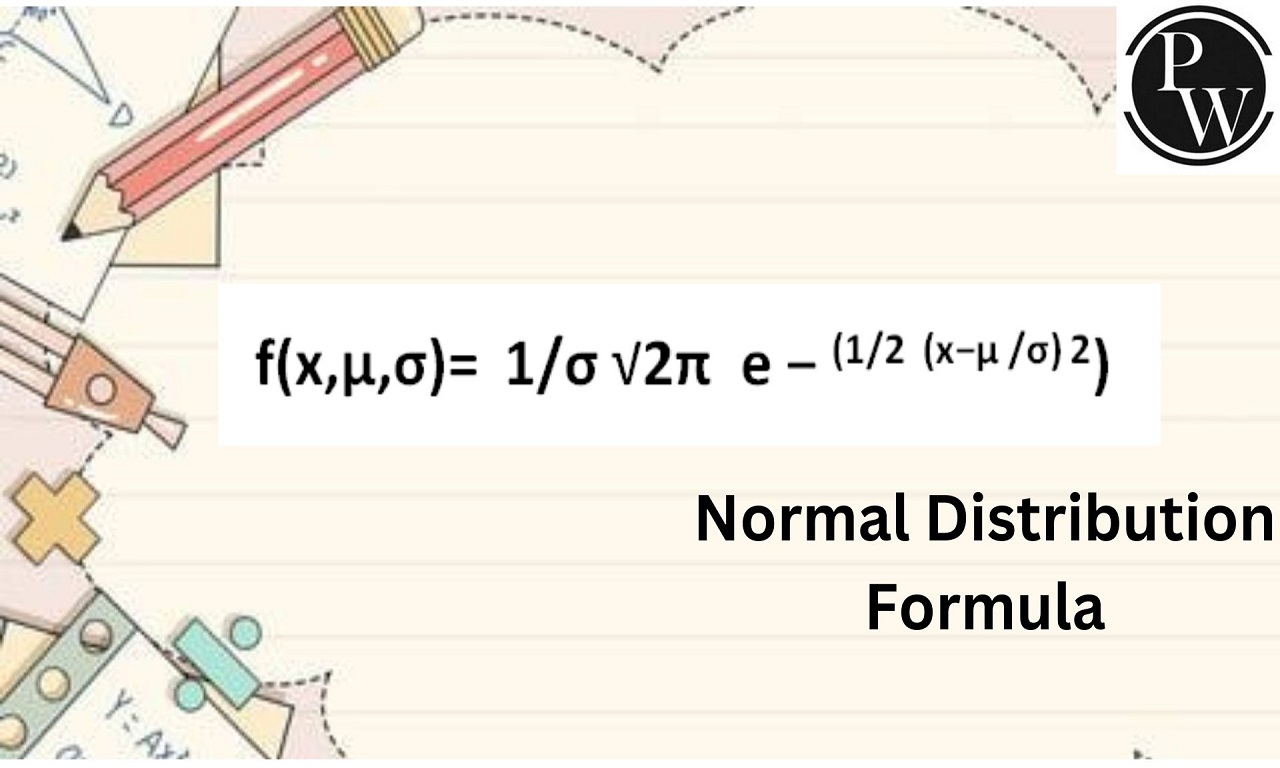
The normal distribution characterizes a continuous random variable X through its probability density function, denoted as f(x). This function, when integrated across an interval (for instance, x to x + dx), provides the probability of X within that range. Given the infinite values within x and x + dx, a specific range of x is considered. The continuous probability density function adheres to the condition f(x) ≥ 0 for all x in the range from negative infinity to positive infinity, and its integral from negative infinity to positive infinity equals 1. For a random variable X following a normal distribution with a mean (μ) and variance (σ^2), the probability density function f(x) is expressed as:
f(x,μ,σ)= 1/σ √2π e − (1/2 (x−μ /σ) 2 ) This distribution can also be denoted as
X∼N(μ,σ 2 ).
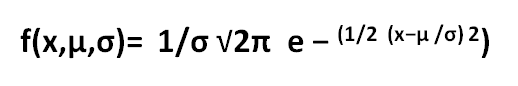
When considering a specific mean (μ) value of 3 and a standard deviation (σ) ranging from 1 to 3, the probability density function (p.d.f.) of the normal or Gaussian distribution is given by: The probability density function for the normal or Gaussian distribution is expressed as:
f(x,μ,σ)= 1/σ √ 2π e (− 1/2 (x−μ /σ) 2 )
Where: x represents the variable μ stands for the mean σ is the standard deviation.
Normal Distribution Formula Solved Examples
Example 1: If X∼N(4,9), to find P(X>6) using the normal distribution formula:
Given X∼N(μ,σ 2 ) where μ is the mean and σ is the standard deviation. The transformation Z= X−μ / σ = X−4 / 3 .
Hence,
P(X>6)
=1−P(X<6)
=1−ϕ( 6−4 / 3 )
=1−ϕ(0.67)
=1−0.74857
=0.25143
Therefore, P(X>6)=0.25143.
Example 2: The working lives of a specific brand of electric light bulb follow a distribution with a mean of 1200 hours and a standard deviation of 200 hours. To find the probability of a bulb lasting more than 1150 hours using the normal distribution formula:
Given X∼N(1200,200 2 ),
thus: P(X>1150)
=1−P(X<1150)
=1−ϕ( 1150−1200 / 200 )
=1−ϕ(−0.25)
=0.59871
Therefore, the probability of a bulb lasting more than 1150 hours is 0.59871.
Example 3: For the data x=3, μ=4, and σ=2, to determine the probability density function of the normal distribution:
Using the probability density formula of the normal distribution:
f(3,4,2)= 1 / 2 √ 2π e − ((3−4) 2/ 2×2 2 )
=1.106
Thus, f(3,4,2)=1.106.
Example 4: Given a distribution where X follows a normal distribution with a mean of 50 and a standard deviation of 10.Find P(X<60) using the normal distribution formula.
Solution: For X∼N(50,10 2 ):
P(X<60)
=ϕ( 60−50 / 10 )
=ϕ(1)=0.8413
Hence, the probability that X<60 is 0.8413.
Example 5: Suppose the heights of a certain population follow a normal distribution with a mean of 170 cm and a standard deviation of 8 cm. What is the probability that a randomly chosen person is taller than 180 cm?
Solution: Let X represent the height and follow X∼N(170,8 2 ). Therefore:
P(X>180)
=1−P(X≤180)
=1−ϕ( 180−170 / 8 )
=1−ϕ(1.25)
=1−0.8944
=0.1056
The probability that a randomly chosen person is taller than 180 cm is 0.1056 0.1056.
Example 6: Assuming a distribution of test scores follows a normal distribution with a mean of 75 and a standard deviation of 10. What is the probability that a randomly selected student scores below 60?
Solution: Given X∼N(75,10 2 ):
P(X<60)
=ϕ( 60−75 / 10 )
=ϕ(−1.5)=0.0668
Thus, the probability that a randomly selected student scores below 60 is 0.0668.
Explore Now Online Course of Class 9 Neev Fastrack 2024 and Class 10 Udaan Fastrack 2024 to enhance your Maths knowledge. and build a strong foundation.
| Related Links | |
| Orthocenter Formula | Percent Difference Formula |
| Perfect Square Formula | Retention Factor Formula |
Normal Distribution Formula FAQs
What is the normal distribution formula?
How is a normal distribution defined?
What does μ represent in the normal distribution formula?
What does σ represent in the normal distribution formula?