IELTS Writing Task 1, Format, Question Types, Sample Answers

IELTS Writing Task 1: The IELTS exam is divided into two parts: IELTS Writing Task 1 and IELTS Writing Task 2. Task 1 of the IELTS Writing part has been designed to test the ability of students to interpret and analyze data presented in the prompt. In this section, students are provided with visual information such as graphs, charts, tables, and diagrams. The IDP IELTS asked students to analyze the given data and summarize the key points. The IELTS Writing Task 1 test format is typically similar for both academic and general training, however, students can modify their answer writing format depending on the type.
- IELTS Complaint Letter Sample Answers
- IELTS General Writing Task 1 Informal Letter
- Free IELTS Writing Practice Tests PDF
IELTS Writing Task 1 Overview
IELTS Writing Task 1 assesses the ability of students to interpret and present visual data. The duration of the test is 20 minutes and candidates are required to write at least 150 words. The task involves analyzing a chart, graph, diagram, or table.IELTS Writing Task 1 Question Types
IELTS Writing Task 1 presents different types of questions to assess the ability to interpret and present information clearly and logically. Below are the different types of IELTS Writing Task 1:- Line Graphs
- Bar Charts
- Pie Charts
- Tables
- Maps
- Process Diagrams
- Mixed Graphs
- Combined Questions
Click Here to Explore IELTS Online Courses
IELTS Writing Task 1 Exam Format
Here's a brief description of the IELTS Writing Task 1 exam format:| Feature | Details |
|---|---|
| Task Type | Visual data representation |
| Word Count Limit | Minimum 150 words |
| Time Limit | 20 minutes |
| Number of Questions | 1 question |
| Scoring Criteria |
|
| Structure |
|
| Task Requirement | No personal opinions, only objective data description |
Check:- Types of IELTS Writing Task 1 questions
IELTS Writing Task 1 Academic and General Training
Academic Writing Task 1: The academic version of IELTS Writing Task 1 involves interpreting visual data related to academic subjects. This includes:- Graphs (line, bar, pie)
- Tables
- Diagrams (processes, cycles, maps)
- A formal letter (to a business or authority)
- An informal letter (to a friend or family member)
- A semi-formal letter (to an acquaintance or colleague)
IELTS Writing Task 1 Lessons
The IELTS writing exam lasts 60 minutes and consists of two writing tasks. Task 1 in the IELTS writing part is more objective. IELTS Writing Task 1 is available in two versions: IELTS Writing Task 1 for General Training and IELTS Writing Task 1 for Academic.- Lesson 1: Charts Lesson
- Lesson 2: Maps Lessons
- Lesson 3: Multiple Graphs and Charts
- Lesson 4: Process Lesson
Tips and Tricks for IELTS Writing Task 1
Academic Writing Task 1 Tips : To excel in Academic Writing Task 1, students can follow the below-mentioned tips and tricks:- Before starting the answer writing, identify key trends in the data.
- Do not include all statistical details and only focus on the main points.
- Use appropriate vocabulary to describe trends (e.g., increase, decline, fluctuate).
- To show comparisons or contrast use linking words.
- Prepare a standard structure for your answer: Introduction, overview, and body paragraph.
- Follow a clear format: Start with an appropriate greeting, then provide the necessary details.
- Be concise but cover all required points.
- Use formal language for official letters and informal for personal letters.
- Check tone and style: Ensure the letter matches the purpose.
- Mind your grammar and spelling: These are crucial for letter writing.
Also Check:
IELTS Writing Task 1 Sample Answers
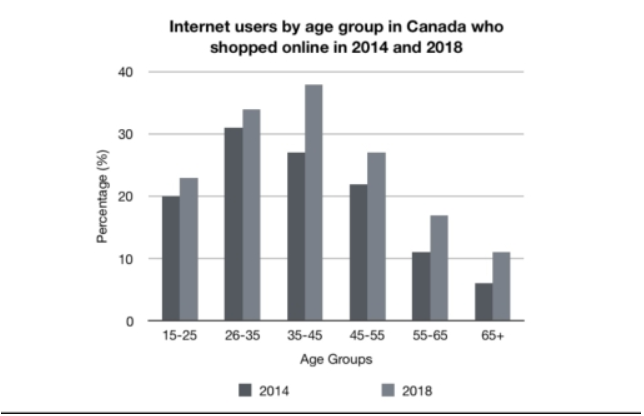
Question : The bar chart below shows the percentage of people in different age groups who used the Internet in five countries in 2012. Summarize the information by selecting and reporting the main features, and make comparisons where relevant.
 Sample Answer:
The bar chart illustrates the proportion of internet users across various age groups in five nations in 2012. Overall, internet usage was generally higher in younger age groups, with some notable exceptions.
In Japan, internet penetration was remarkably high across all age groups, with over 80% of individuals aged 16-24 and 65 and over accessing the internet. A similar trend was observed in the UK, although the overall usage rates were slightly lower.
In contrast, internet usage in India was significantly lower, particularly among older age groups. Only around 10% of those aged 65 and over used the internet, compared to over 50% in the 16-24 age group. China and South Korea showed a more mixed pattern, with high usage rates among younger people but lower rates among older adults.
In conclusion, the bar chart highlights the varying levels of internet adoption across different age groups and countries in 2012. While younger generations were generally more likely to use the internet, there were significant disparities between countries, suggesting varying levels of digital inclusion.
Sample Answer:
The bar chart illustrates the proportion of internet users across various age groups in five nations in 2012. Overall, internet usage was generally higher in younger age groups, with some notable exceptions.
In Japan, internet penetration was remarkably high across all age groups, with over 80% of individuals aged 16-24 and 65 and over accessing the internet. A similar trend was observed in the UK, although the overall usage rates were slightly lower.
In contrast, internet usage in India was significantly lower, particularly among older age groups. Only around 10% of those aged 65 and over used the internet, compared to over 50% in the 16-24 age group. China and South Korea showed a more mixed pattern, with high usage rates among younger people but lower rates among older adults.
In conclusion, the bar chart highlights the varying levels of internet adoption across different age groups and countries in 2012. While younger generations were generally more likely to use the internet, there were significant disparities between countries, suggesting varying levels of digital inclusion.
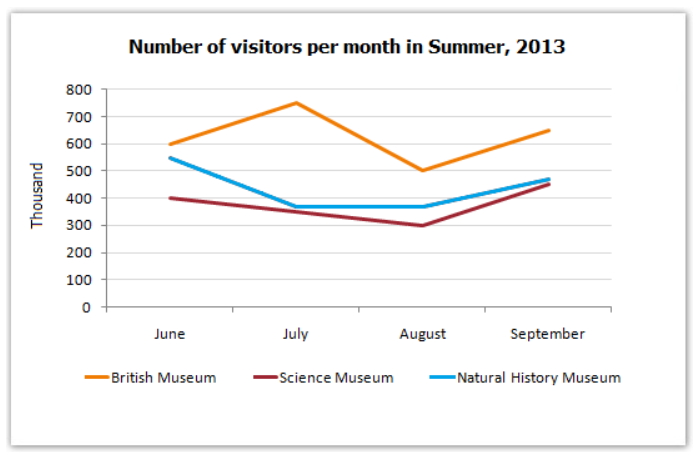
Question : The line graph below illustrates the changes in the number of visitors to three different museums in a major city between 2000 and 2020. Summarize the information by selecting and reporting the main features, and make comparisons where relevant.
 Sample Answer:
The line graph presents the fluctuations in visitor numbers to three museums – the Science Museum, the Art Gallery, and the History Museum – over twenty years from 2000 to 2020. Overall, there were significant variations in visitor trends across the three institutions.
The Science Museum experienced a consistent upward trend throughout the entire period, with visitor numbers steadily increasing from approximately 500,000 in 2000 to a peak of nearly 1,200,000 in 2020. In contrast, the Art Gallery witnessed a more volatile pattern. While it saw a substantial rise in visitors between 2000 and 2010, reaching a high of around 800,000, there was a subsequent decline, with numbers falling below the 2000 level by 2020.
The History Museum, on the other hand, experienced a period of stagnation from 2000 to 2010, with visitor numbers remaining relatively stable at around 400,000. However, there was a marked increase in the latter half of the period, culminating in a significant surge in 2020, surpassing the Science Museum to become the most visited museum that year.
In conclusion, the line graph reveals distinct patterns in visitor numbers to the three museums over the two decades. While the Science Museum maintained consistent growth, the Art Gallery experienced a decline after an initial period of success, and the History Museum demonstrated a period of stagnation followed by a surge in popularity.
Sample Answer:
The line graph presents the fluctuations in visitor numbers to three museums – the Science Museum, the Art Gallery, and the History Museum – over twenty years from 2000 to 2020. Overall, there were significant variations in visitor trends across the three institutions.
The Science Museum experienced a consistent upward trend throughout the entire period, with visitor numbers steadily increasing from approximately 500,000 in 2000 to a peak of nearly 1,200,000 in 2020. In contrast, the Art Gallery witnessed a more volatile pattern. While it saw a substantial rise in visitors between 2000 and 2010, reaching a high of around 800,000, there was a subsequent decline, with numbers falling below the 2000 level by 2020.
The History Museum, on the other hand, experienced a period of stagnation from 2000 to 2010, with visitor numbers remaining relatively stable at around 400,000. However, there was a marked increase in the latter half of the period, culminating in a significant surge in 2020, surpassing the Science Museum to become the most visited museum that year.
In conclusion, the line graph reveals distinct patterns in visitor numbers to the three museums over the two decades. While the Science Museum maintained consistent growth, the Art Gallery experienced a decline after an initial period of success, and the History Museum demonstrated a period of stagnation followed by a surge in popularity.
| IELTS Writing Task 1 Related Links | |
|---|---|
| IELTS General Writing Task 1 | IELTS Writing Task 1 Connectors |
| IELTS Writing Task 1 vs. Writing Task 2 | IELTS Writing Word Limit Guidelines |
Q: Can I use bullet points in my answer?
Q: How do I improve my score in Task 1?
Q: Can I use personal opinions in IELTS Writing Task 1?
Q: Is it important to use data in my response?