
IELTS Table Chart Task 1 Sample Question and Answers, Tips
IELTS Table Chart Task 1: IELTS Writing Task 1 is a crucial component of the IELTS Writing test. In the Table Chart task, candidates are presented with statistical or numerical data organized in rows and columns. The primary objective is to interpret and summarize the information accurately and coherently. This task is assessed based on four key criteria: Task Achievement, Coherence and Cohesion, Lexical Resource, and Grammatical Range and Accuracy.
This guide offers a comprehensive overview of the IELTS Table Chart Task 1. It covers essential aspects such as understanding the structure of table charts, following a standard response framework, applying practical writing tips, and recognizing common errors to avoid.
Structure of Answering IELTS Writing Task 1 Table Chart Questions
Here’s an ideal structure for answering the IELTS Writing Task 1 table chart questions.1. Introduction
- Paraphrase the question.
- State what the table represents.
2. Overview
- Summarize the main trends or overall patterns.
- Highlight significant changes, the highest and lowest figures, or noticeable patterns.
3. Body Paragraphs
- Provide detailed comparisons and highlight key data points.
- Group similar data together for clarity.
- Use accurate numbers and percentages.
IELTS Table Chart Task 1 Practice Question
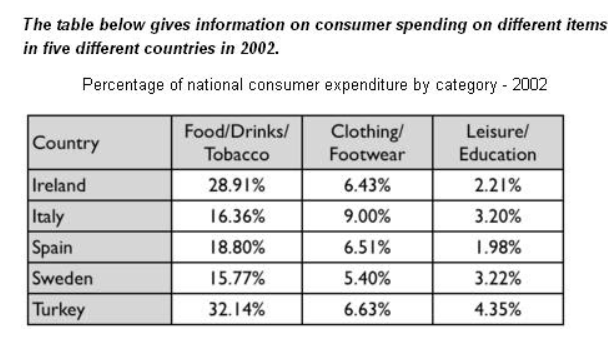
Question: The table depicts the percentage of national consumer spending on food/drinks/tobacco, clothing/footwear, and leisure/education in five different nations in 2002. Summarise the data by selecting and reporting the most important elements, and making comparisons where appropriate.
IELTS Table Chart Task 1 Sample Answer
Introduction:
The table illustrates consumer expenditure in five countries—Turkey, Italy, Spain, Sweden, and Ireland—in the year 2002. Spending is categorized into three sectors: food, drinks, and tobacco; clothing and footwear; and leisure and education.
Overview:
Overall, consumer spending patterns varied notably among the five nations. Expenditure on food, drinks, and tobacco accounted for the highest proportion in all countries, followed by clothing and footwear. In contrast, leisure and education consistently received the smallest share of spending.
Body Paragraph 1:
With regard to food, drinks, and tobacco, Turkey recorded the highest spending at 32.14%, indicating a strong emphasis on this category. In comparison, Italy reported the lowest expenditure at 16.36%. These figures reflect significant disparities, which may be influenced by cultural practices, consumption habits, or economic conditions.
Body Paragraph 2:
When it comes to clothing and footwear, Italy topped the list with an expenditure of 9.00%, while Sweden registered the lowest at 5.40%. These differences could stem from variations in fashion awareness, climate, or individual spending priorities in each country.
Body Paragraph 3:
As for leisure and education, Turkey again ranked highest with 4.35% of total expenditure, whereas Ireland allocated the least at just 2.21%. This indicates diverse national priorities regarding recreational activities and educational investments.
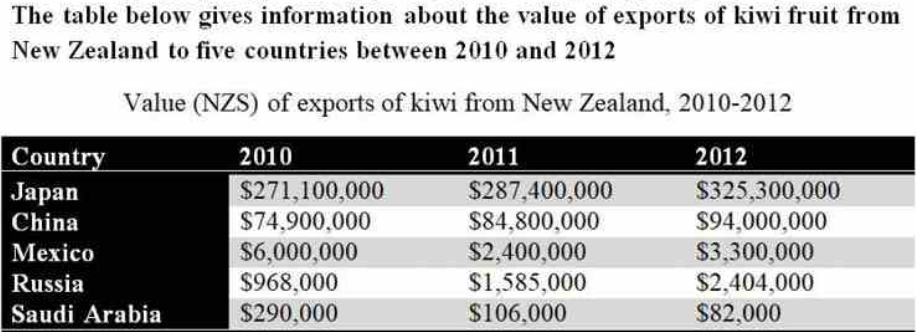
Question: Describe the changes in the value of kiwi fruit exports from New Zealand to Saudi Arabia between 2010 and 2012.
IELTS Table Chart Task 1 Sample Answer :
Introduction:
The table presents data on the export value of kiwi fruit from New Zealand to Saudi Arabia over three years, from 2010 to 2012.
Overview:
Overall, there was a marked decline in the value of kiwi fruit exports to Saudi Arabia throughout the given period, indicating a downward trend in trade between the two countries.
Body Paragraph 1:
In 2010, the export value reached $290,000. By 2011, this amount had dropped significantly to $106,000, representing a sharp decrease of nearly two-thirds within a year.
Body Paragraph 2:
The decline continued into 2012, with export earnings falling further to $82,000. This consistent downward trend suggests a notable reduction in demand for New Zealand kiwi fruit in the Saudi Arabian market over the three years.
Tips for Writing IELTS Table Chart Task 1
Here are some common tricks and tips for answering line graph questions in the IELTS Table Chart Task 1 test:-
Identify Key Features:
Focus on the highest, lowest, and average values in the data. - Use Comparative Language:
Incorporate terms such as “more than,” “less than,” “the most,” and “the least” to describe differences effectively. -
Vary Sentence Structures:
Utilize complex and compound sentences to demonstrate a wide range of grammatical ability. -
Maintain a Formal Tone:
Avoid informal expressions and refrain from sharing personal opinions. -
Practice Time Management:
Allocate approximately 20 minutes to Task 1 to leave sufficient time for Task 2.
Common Mistakes to Avoid
Below is the list of some common mistakes aspirants should avoid to score higher in the IELTS Table Chart Task 1 section:- Avoid listing every single value when comparing different datasets.
- Maintain a formal tone; refrain from using informal or conversational expressions when describing tables.
- Always highlight the overall trends or significant patterns rather than focusing solely on isolated data points.
- Do not attempt to explain every detail in the dataset—prioritize relevance and clarity.
Guidance of PW IELTS
Physics Wallah provides top-notch online IELTS coaching tailored for students. This course aims to effectively support students in their IELTS preparation journey.
| IELTS exam | IELTS Academic Vs General |
| IELTS Registration | IELTS Eligibility Criteria |
| IELTS Exam Pattern | IDP IELTS Test Centers |
| IELTS Cut Off | IELTS Syllabus |
IELTS Table Chart Task 1 FAQs
What is IELTS Table Chart Task 1?
How should I structure my response?
How much time should I spend on Task 1?
What are the key assessment criteria?
Can I include personal opinions in my answer?