IELTS Model Bar Chart Band Score 9, Sample Question & Answer

IELTS Model Bar Chart Band Score 9: The IELTS Writing test includes a Bar Chart Task 1 is to evaluate the ability of students to interpret data and clearly articulate its significance visually. The candidates are asked to analyze and describe a bar chart by comparing various data points and trends. Here, we have provided a standard guide for students including an IELTS Model Bar Chart Band Score 9, sample questions, model answers, and effective strategies for approaching this task. Students must provide a comprehensive and accurate analysis of the chart utilizing a varied vocabulary, cohesive structures, and specific data points to get a high IELTS band score .
What is IELTS Bar Chart in Writing Task 1?
IELTS Bar Chart in Writing Task 1 is a form of visual data representation that employs vertical bars to depict various categories of data. This task is commonly found in the IELTS Writing Module, where candidates are required to describe the information presented in the chart.
Key Features of the IELTS Bar Chart:
- Vertical Bars: The height of each bar indicates the quantity or value of the data for each category.
- Categories: The x-axis displays the different categories being compared.
- Units: The y-axis denotes the units of measurement used for the data.
Check: IELTS Sample Chart for Writing Task 1
IELTS Model Bar Chart Band Score 9 Sample Questions
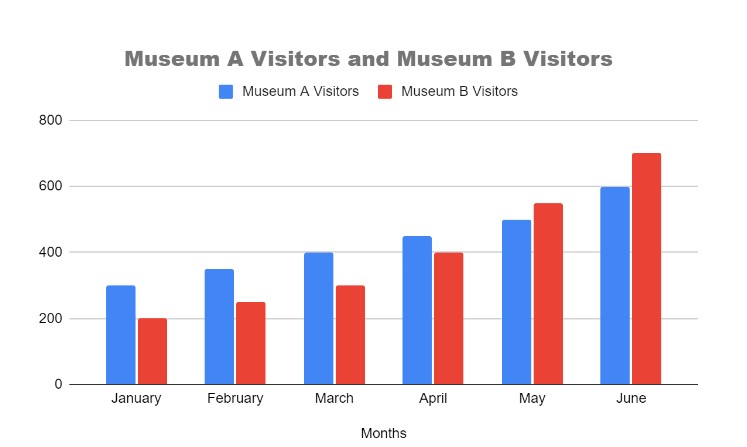
Question 1: The bar chart below shows the number of visitors to two different museums in a city over a six-month period. Summarize the information by selecting and reporting the main features, and make comparisons where relevant.
IELTS Model Bar Chart Band Score 9 Sample Answer
The bar chart illustrates the number of visitors to Museum A and Museum B over a six-month period, from January to June.
Overall, both museums experienced an upward trend in visitor numbers. Initially, Museum A consistently attracted more visitors, but Museum B eventually surpassed Museum A in the final month.
In January, Museum A welcomed 300 visitors, significantly outperforming Museum B, which had only 200 visitors. This pattern continued into February, with Museum A attracting 350 visitors compared to Museum B's 250. By March, the gap widened further, with Museum A reaching 400 visitors, while Museum B managed only 300.
However, from April onwards, the trend shifted. Museum A saw a steady increase to 450 visitors, while Museum B experienced a more dramatic rise, reaching 400 visitors. This momentum continued in May, with Museum A reaching 500 visitors, but Museum B gained more ground, attracting 550 visitors.
The most notable change occurred in June, when Museum B finally surpassed Museum A, reaching a total of 700 visitors compared to Museum A’s 600.
While Museum A initially had higher visitor numbers, Museum B’s growth rate outpaced that of Museum A, culminating in a higher visitor count in June. This data suggests a growing popularity for Museum B, potentially indicating shifts in public interest or improvements in marketing strategies.
Question 2: The bar chart illustrates the expenditure on five different consumer goods in France and the UK in 2010, measured in pounds sterling. Summarize the key features of the information shown, selecting and reporting the main features, and making comparisons where relevant.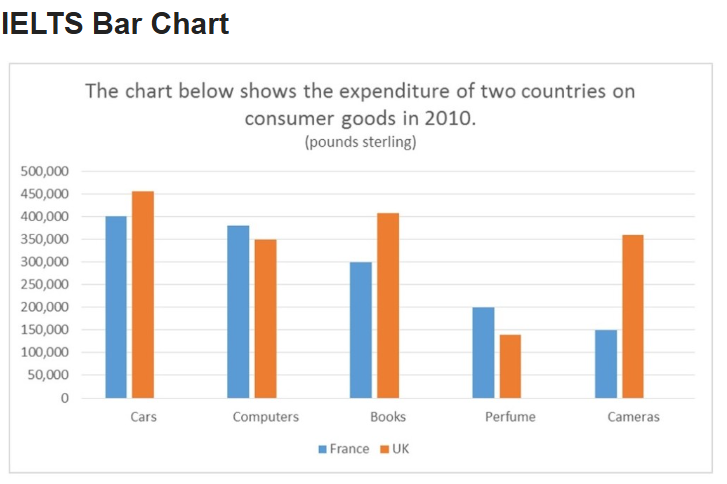
IELTS Model Bar Chart Band Score 9 Sample Answer
The bar chart presents a comparative overview of consumer spending on five goods – cars, computers, books, perfume, and cameras – in France and the UK during 2010. It is evident that the UK consistently outspent France across all categories, with expenditure in several instances exceeding double that of its European neighbor.
The most substantial discrepancy is observed in car purchases, where UK spending reached a staggering 450,000 pounds sterling, dwarfing France's expenditure by approximately 100,000 pounds. A similar trend is seen with computers, though the difference is less pronounced. Notably, while both nations spent significantly on books, the UK's expenditure was markedly higher.
In contrast, the disparity in spending on perfume and cameras was less pronounced. While the UK still led in both categories, the difference was considerably smaller than in the case of cars and computers.
In conclusion, the chart reveals a clear pattern of higher consumer spending across all categories in the UK compared to France in 2010, with the most significant disparities evident in the automotive and computing sectors.
How to Compare Data in IELTS Bar Chart?
Comparing data in an IELTS Bar Chart involves a few key steps:
- Identify Key Trends: Begin by looking for overall patterns in the data. Are there general increases or decreases over time? Are there any noticeable trends?
- Highlight Comparisons: Compare different categories or time periods. Point out where one category is higher or lower than another.
- Use Data Points: Support your comparisons with specific figures. Instead of simply stating "A is higher than B," you could say, "In January, Museum A had 300 visitors, while Museum B had 200."
- Analyze Changes Over Time: If the data spans multiple time periods, discuss how the numbers change. Mention any significant increases, decreases, or shifts that occur.
- Use Varied Vocabulary: Use a diverse range of words to describe increases (e.g., rose, climbed, increased) and decreases (e.g., fell, declined, dropped).
- Keep It Coherent: Ensure your writing is logically organized and easy to understand.
Effectively comparing data requires precision, clarity, and a strong command of descriptive language.
Also Check:
Tips to Approach IELTS Bar Chart Questions to Score 9
The following are the tips for approaching IELTS Bar Chart Questions for Band 9:
- Understand the Task Requirements: It is essential to fully grasp what is expected. The task involves accurately describing the information in the bar chart, emphasizing key trends, and making relevant comparisons.
- Start with a Clear Overview: Begin with a brief introduction that paraphrases the task question. Follow this with an overview summarizing the main trends or features of the chart without excessive detail.
- Organize the Response: Structure the writing logically. Divide it into paragraphs—one for the introduction and overview, and one or two for the detailed analysis.
- Use Precise Vocabulary: Employ a variety of words to describe increases (e.g., rose, climbed, increased), decreases (e.g., fell, declined, dropped), and stable trends (e.g., remained steady, stayed constant).
- Highlight Key Data Points: Support the analysis with specific figures. Include exact numbers, percentages, or other relevant data to substantiate descriptions.
- Compare and Contrast: Make meaningful comparisons between different data points. Point out similarities and differences, and discuss any observed trends or patterns.
- Use a Range of Sentence Structures: Demonstrate grammatical proficiency by incorporating various sentence structures, including complex sentences, conditional sentences, and relative clauses as appropriate.
- Stay Coherent and Cohesive: Ensure the writing flows logically from one idea to the next. Use linking words and phrases (e.g., moreover, however, on the other hand) to connect thoughts and assist the reader in following the argument.
- Practice Time Management: Allocate around 20 minutes for Task 1. Practicing under timed conditions helps in becoming accustomed to managing time effectively during the exam.
- Proofread the Work: Reserve a few minutes at the end to review the answer. Check for grammatical errors, spelling mistakes, and areas that could be clearer.
Following these tips will aid in achieving a Band 9 in the IELTS Bar Chart Task 1. Consistent practice will lead to improvement and success.
| IELTS Exam Other Related Links | |
|---|---|
| I ELTS Exam | IELTS Full Form |
| IELTS Registration | IELTS Eligibility Criteria |
| IELTS Exam Pattern | IELTS Syllabus |
| IELTS Exam Dates | IDP IELTS Test Centers |
| IELTS Cut Off | IDP IELTS Slot Booking |
| IELTS Mock Test | IELTS Academic Vs General |
IELTS Model Bar Chart Band Score 9 FAQs
What is the IELTS Bar Chart in Writing Task 1?
What are the key features of an IELTS Bar Chart?
How can data be effectively compared in an IELTS Bar Chart?
What tips help in achieving a Band 9 score in IELTS Bar Chart questions?