
How to Describe Pie Charts in IELTS Writing task 1?
The answer to How to describe pie charts in IELTS Writing Task 1 given in this article. It includes all steps to structure your answer. Stay tuned for more details.
Share
How to describe pie charts in IELTS Writing Task 1 : To help in the preparation for the IELTS exam, will give you a step-by-step guide on how to organize your pie chart description to get excellent scores on your writing task 1. IELTS writing task 1 , your objective is to summarize the major aspects and offer comparisons where necessary. To assist you with this, here are a few tips.
What exactly is a pie chart?
A pie chart shows the connection of the parts to the whole by graphically comparing the sizes of the sectors (slices). They may be built with only a circle or with a hundred disks. The circle is based on the idea that 360 degrees represent the whole of things, while the hundreds disk is based on the idea that everything is 100%. Both approaches to pie chart making are valid and will provide the same results. In the article How to describe pie charts in IELTS Writing Task 1 , the parts are colored differently so that the observer can see the changes in size. For Example, Students can see in the pie chart given below:IELTS Sample Charts for Writing Task 1
How to Describe Pie Charts in IELTS Writing Task 1
Pie charts are called by their shape, which is like a wonderful pie. A circular chart with different divisions, each denoting a value, is included in these charts. IELTS Writing Task 1 requires you to examine the chart and answer the provided questions. This is the approach you can take while answering How to describe pie charts in IELTS Writing Task 1.Analyze the Question
Read the question carefully. Understand the meaning behind each value. You can be asked to write about the key characteristics, compare the key aspects, or summarize the information. It's critical to pay attention and provide an accurate answer to the question's clear objective. Don't try to answer too many questions. When describing the key aspects, choose two or three that really run out. Don't try to address everything.Identify the key features
The features of the graph that naturally stand out are its key characteristics. It may be a consistent and reliable pattern or trend, the measuring units, or even the labels on the graph. Can you identify which group has the greatest and lowest rates of poverty, for example, if the chart is about persons living in poverty? Your primary characteristics are these. The primary characteristics will vary between charts. Avoid being too mathematical and try to keep things simple. Here are a few actions you may take:- Pay close attention to the labels and titles.
- Analyze the ratios of every division.
- Determine which proportions are greatest and lowest.
- Look for any patterns or trends in the chart.
- Make a brief comparison of the components.
| IELTS Pie Chart Task 1 | Cohesive Devices in IELTS Writing |
Structure description or report.
After you have mastered the principles of your chart, organize your essay. The most traditional format for any kind of writing is as follows:Outline
Start by restating the question in simple terms. One way to put it might be, "The percentage of various family types living in poverty in the UK in 2002 is shown in the chart above."Introduction
Draw attention to the text's key points and provide a brief explanation for each.Body Paragraph 1
Increase the primary functions and go into the specifics. Write down the whats, hows, and whys. To support your claims, use the pie chart's percentages. This may be used in the first two paragraphs of your essay's body.Body Paragraph 2
This is where you compare the key components of the graph if the question requires you to compare data. Make an effort to complete everything in order and avoid picking a side. To create a comparison, use phrases like "On the other hand," "In contrast," or "Similarly."Conclusion
Write a summary of the things you took out of the chart and, if needed, offer any last suggestions.Also Check:
Sample Question of Pie Chart
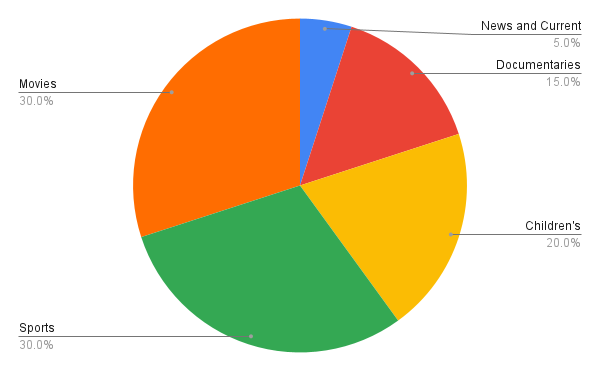
The percentages of a 24-hour day that a TV station broadcast various program types are shown in the table.| News and Current Affairs | Documentaries | Children's programmes | Sports | Movies |
| 5% | 15% | 20% | 30% | 30% |
 Sample Question of Pie Chart[/caption]
- Determine how many hours are spent showing films on television.
- Create a pie chart to illustrate this data.
IELTS Pie Chart Reading Tips
First, let's go over some basic advice on how to read a pie chart in your IELTS academic writing task. It is important to keep in mind the following advice from the time you first see the provided pie charts until you have completed writing task 1:- Don't lose hope if you are unable to compare the data on your pie charts. Giving an overview of each picture is acceptable in this situation. Make comparisons where appropriate.
- Avoid providing personal views at any cost. For example, if the graph indicates growing costs and you know that the Middle East conflict is to blame, keep quiet. It is not appropriate to discuss your views.)
- Always use the right tense (past, present, or future), and be mindful of the period of your pie charts.
- Make sure to include all relevant information from the pie charts and graphs in your paper.
| IELTS Writing Related Links | |
|---|---|
| IELTS Writing Band Score | IELTS Writing Band Descriptors |
| IELTS Writing Test Format | IELTS Writing Task 1 |
Guidance of PW
The goal of PW IELTS coaching is to help students get a high band score. The goal of PW IELTS coaching is to help students improve their English language abilities so they may work or seek further education in English-speaking countries. Physics Wallah's proficient teachers can assist students in improving their English language skills in IELTS online sessions. PW provides academic IELTS teaching and general training.How to describe pie charts in IELTS Writing task 1</span><span style=
Q1 - What terms are appropriate for describing pie charts?
Ans - Pie charts are mostly described using terms related to proportions and percentages. "The proportion of" and "the percentage of" are two examples of popular expressions that might be employed. In contrast, other expressions may refer to a sizable portion, a small minority, less than 4%, etc.
Q2 - How come a pie chart is helpful?
Ans - Data may be arranged and shown as a proportion of the total using a pie chart. As suggested by the name, this kind of representation uses a circle to symbolize the whole thing and slices, or "pies," of that circle to symbolize the many categories which make constitute the whole.
Q3 - How should the pie chart be explained?
Ans - One type of graph that shows the data in the circular graph is a pie chart. Pie slices are a type of graphical depiction of data that indicates the relative importance of the data. Both numerical and category data must be included to create a pie chart.
Q4 - What is a chart's description?
Ans - Large amounts of data and the links between different portions of the data are often made easier to grasp with the help of charts. Generally speaking, charts are easier to understand than raw data. They are made by hand (usually on graph paper) or by computer using a charting program, and they are used in many different disciplines.
🔥 Trending Blogs
Talk to a counsellorHave doubts? Our support team will be happy to assist you!

Check out these Related Articles


Join 15 Million students on the app today!

Free Learning Resources
PW Books
Notes (Class 10-12)
PW Study Materials
Notes (Class 6-9)
Ncert Solutions
Govt Exams
Class 6th to 12th Online Courses
Govt Job Exams Courses
UPSC Coaching
Defence Exam Coaching
Gate Exam Coaching
Other Exams
Know about Physics Wallah
Physics Wallah is an Indian edtech platform that provides accessible & comprehensive learning experiences to students from Class 6th to postgraduate level. We also provide extensive NCERT solutions, sample paper, NEET, JEE Mains, BITSAT previous year papers & more such resources to students. Physics Wallah also caters to over 3.5 million registered students and over 78 lakh+ Youtube subscribers with 4.8 rating on its app.
We Stand Out because
We provide students with intensive courses with India’s qualified & experienced faculties & mentors. PW strives to make the learning experience comprehensive and accessible for students of all sections of society. We believe in empowering every single student who couldn't dream of a good career in engineering and medical field earlier.
Our Key Focus Areas
Physics Wallah's main focus is to make the learning experience as economical as possible for all students. With our affordable courses like Lakshya, Udaan and Arjuna and many others, we have been able to provide a platform for lakhs of aspirants. From providing Chemistry, Maths, Physics formula to giving e-books of eminent authors like RD Sharma, RS Aggarwal and Lakhmir Singh, PW focuses on every single student's need for preparation.
What Makes Us Different
Physics Wallah strives to develop a comprehensive pedagogical structure for students, where they get a state-of-the-art learning experience with study material and resources. Apart from catering students preparing for JEE Mains and NEET, PW also provides study material for each state board like Uttar Pradesh, Bihar, and others
Copyright © 2026 Physicswallah Limited All rights reserved.