IELTS Pie Chart Writing Task 1 Sample Answer, Vocabulary, Tips

IELTS Pie Chart Writing Task 1: The IELTS Writing Task 1 has a wide range of mathematical data sets in the form of pie charts. The IELTS Pie Chart Writing Task 1 includes various information about education, tourism, advertisement, literacy, development, and other important topics. Candidates are required to describe, summarize, or explain the information presented in a pie chart within 150 words. Here, we have included a sample practice question on the IELTS Pie Chart Writing Task 1 with a model answer. Students can read the complete writing to learn more about IELTS Pie Chart Writing Task 1 types, tips and tricks to attempt them, sample practice questions, and more.
- IELTS Complaint Letter Sample Answers
- IELTS General Writing Task 1 Informal Letter
- Free IELTS Writing Practice Tests PDF
IELTS Pie Chart Writing Task 1
A pie chart is a visual representation of numerical proportions in a circular statistical graphic. In a pie chart, the circle is divided into small “slices” or “segments” each segment representing percentages of different categories. In IELTS table chart task 1, candidates are evaluated based on their writing proficiency on key trends, comparisons of segments, and highlighting significant data points using appropriate pie chart vocabulary.Task Requirements:
-
Describe and summarise key features of the data
-
Compare and contrast information
-
Avoid including your opinion
-
Maintain formal language throughout
Click Here to Explore IELTS Online Courses
IELTS Band Descriptors for Task 1
To score a Band 9 in Writing Task 1, you need to meet the following criteria based on the IELTS Writing Band Descriptors:
|
Criterion |
Band 9 Description |
|---|---|
|
Task Achievement |
Fully satisfies all task requirements; presents a clear overview and supports with data |
|
Coherence and Cohesion |
Seamless organisation; cohesive devices are used effectively |
|
Lexical Resource |
Wide range of vocabulary with flexibility and precision |
|
Grammatical Range and Accuracy |
Uses a wide range of structures; error-free throughout |
Check:- Types of IELTS Writing Task 1 questions
Structure of a Band 9 IELTS Pie Chart Essay
A clear and logical structure is crucial for a high band score. A typical pie chart essay includes four paragraphs:
1. Introduction
Paraphrase the question and state what the pie chart(s) illustrate.
2. Overview
Summarise the main trends or features without specific data.
3. Body Paragraph 1
Describe the first half of the chart or the most significant information.
4. Body Paragraph 2
Explain the remaining data, focusing on comparisons and trends.
Useful Vocabulary for Pie Chart Tasks
Paraphrasing Words:
-
Illustrate → show, depict, present, represent
-
Proportion → percentage, share, segment
-
Information → data, statistics
Comparative Language:
-
Larger than, smaller than
-
The majority/minority
-
Roughly equal, almost identical
-
Accounted for, comprised, constituted
Time-related Phrases:
-
In 1990, By 2020, Over the period, During the decade
General Phrases:
-
The most significant change was…
-
There was a noticeable increase/decrease…
-
A considerable portion of…
-
The least/most popular category…
| IELTS Writing Task 1 Related Links | |
|---|---|
| IELTS General Writing Task 1 | IELTS Writing Task 1 Connectors |
| IELTS Writing Task 1 vs. Writing Task 2 | IELTS Writing Word Limit Guidelines |
IELTS Pie Chart Writing Task 1 Sample Question with Answer
Sample Question: The pie chart below shows the percentage of ad spending by different kinds of media in India from 2012 to 20 2017. Explain the pie chart. 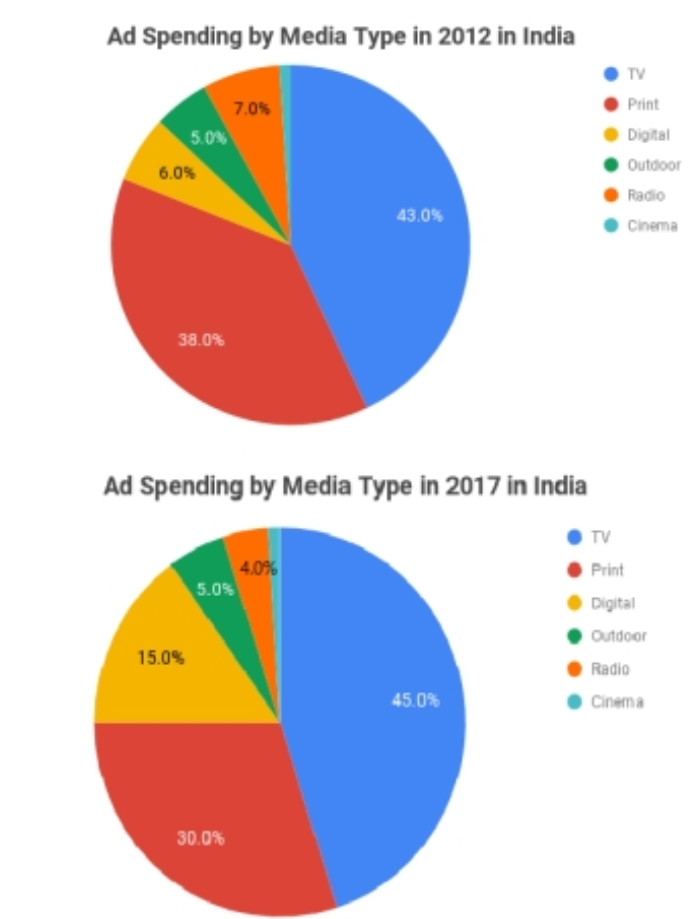
IELTS Pie Chart Task 1 Model Question
Question:
The pie charts below show the percentage of household income spent on various categories in 2001 and 2011 in a European country.
Summarise the information by selecting and reporting the main features and make comparisons where relevant.
Band 9 Model Answer
Introduction:
The two pie charts illustrate the distribution of household income spent on various categories in a European nation in 2001 and 2011.
Overview:
Overall, the most noticeable change over the ten-year period is the increase in the proportion of income spent on food and housing, while expenditure on clothing and entertainment declined. The rest of the categories witnessed minor changes.
Body Paragraph 1:
In 2001, the largest proportion of income was allocated to housing at 30%, followed by food at 25%. Transportation and entertainment accounted for 15% and 10% respectively, while only 5% was spent on clothing and the remaining 15% on other miscellaneous items.
By 2011, there was a significant increase in the budget allocated to food, which rose to 35%, surpassing housing, which slightly decreased to 27%. This indicates a shift in spending priorities over the decade.
Body Paragraph 2:
Clothing expenditure experienced a substantial decline from 5% to just 2%, suggesting reduced spending in this category. Entertainment also saw a minor drop to 7%. On the other hand, transportation remained relatively stable, experiencing only a 1% drop. Miscellaneous expenses remained constant at 15%.
The changes reflect a trend towards prioritising essential needs such as food, likely due to economic changes or inflation. The reduced spending on non-essentials like entertainment and clothing further supports this shift in household priorities.
IELTS Pie Chart Writing Task 1 Vocabulary
The correct use of words can impact the overall sentence structure. Choosing the proper vocabulary can enhance the quality of your answer by up to 25%. Here are some essential pie chart vocabulary for IELTS:| IELTS Pie Chart Vocabulary | |
|---|---|
| Sentences | Popular words |
| Percentage and fraction | percent, a quarter, a third, a half, two-thirds |
| Comparative phrases | larger than, smaller than, the same as, compared to, in comparison with, etc |
| Trends and changes | Increase, decrease, grow, drop, remain stable, fluctuate, peak, plummet, etc |
| Segments and sections | Segment, section, slice, portion, etc |
| Descriptive adjectives | Significant, minor, substantial, negligible, considerable, etc |
| Introduction and conclusion phrases | Start with phrases like The pie chart illustrates, This chart represents, etc |
| Time frames | Over the period, from...to..., during, and in the year |
| Specific data reference | According to the chart, the chart shows that, and as indicated in the chart |
| Generalising | Approximately, about, nearly, almost, roughly, etc |
| Transitional phrases | Moreover, Furthermore, However, On the other hand, etc |
How to Compare Data in IELTS Pie Chart Task 1?
When analyzing pie charts for the IELTS Writing Task 1, it’s essential to communicate the changes and comparisons between different segments. The following is a structured approach using the example of energy consumption across four sectors—Residential, Commercial, Industrial, and Transportation—from 2000 to 2020.
Step 1: Understand the Pie Charts
Start by identifying the categories present in each pie chart. In this case, the sectors are Residential, Commercial, Industrial, and Transportation.
Step 2: Examine the Data
Next, focus on the percentages that each sector represents. In 2000, the industrial sector led the energy consumption with 35%, followed by the residential sector with 30%, the commercial sector with 25%, and the transportation sector with 10%.
Step 3: Highlight Key Changes
Discuss the changes that occurred by 2020. For example:
- The Residential sector decreased to 25%.
- The Commercial sector increased to 30%.
- The Industrial sector declined to 30%.
- The Transportation sector grew by 15%.
Step 4: Identify Major Trends
Summarize the trends observed. In this case, it is clear that:
- The Industrial sector's consumption decreased.
- Both the Commercial and Transportation sectors gained a larger share.
This indicates a potential shift in priorities regarding energy consumption and may reflect advancements in energy efficiency or changes in industry practices over the two decades.
Step 5: Provide an Overview
Conclude your analysis with a statement that encapsulates the overall trend. For Example:
"Overall, the data reveals a noteworthy trend, while the Industrial sector's consumption decreased, both the Commercial and Transportation sectors gained a larger share of energy use."
Following these steps, you can effectively compare data in the IELTS Task 1 pie charts, ensuring your analysis is clear and well-structured.
Also Read:
- IELTS Writing Task 1
- IELTS Writing Task 2
- IELTS Writing Task 2 Sample Answer, Tips and Mistakes to Avoid
Tips to Score Band 9 in IELTS Pie Chart Task
1. Paraphrase Effectively
Avoid copying phrases from the question. Use synonyms and change the sentence structure.
Example:
Original: The pie charts show how household income was spent…
Paraphrased: The pie charts illustrate the distribution of household spending…
2. Provide an Overview
An overview paragraph is essential for a Band 7 or above. Summarise the key changes or trends without including detailed figures.
3. Use Data to Support Key Points
Always back up your comparisons or statements with relevant percentages or proportions from the chart.
4. Use a Range of Vocabulary
Repeat vocabulary can reduce your score. Use varied expressions for describing data and comparisons.
5. Be Grammatically Accurate
Use a mix of simple, compound, and complex sentences. Avoid grammatical mistakes.
Example:
-
Simple: Food accounted for 25%.
-
Complex: While food accounted for 25% of income, housing took up a larger share at 30%.
IELTS Writing Scoring, Marking Scheme and Score
Common Mistakes to Avoid
|
Mistake |
Why It Lowers Score |
|---|---|
|
Giving personal opinions |
Task 1 requires objective description only |
|
Including data in the overview |
Overview should not contain numbers |
|
Inconsistent tenses |
Use past tense for past data consistently |
|
Not mentioning all categories |
Cover all key features, even briefly |
|
Repeating words and phrases |
Shows limited vocabulary range |
Additional Practice Questions
To build your skills, practice with sample questions:
-
The pie charts show the population by age group in two years.
-
The pie charts depict the use of energy in different sectors.
-
The pie charts illustrate the distribution of spending on education in three countries.
Always apply the same 4-paragraph format and focus on key differences and similarities.
100 IELTS Essay Questions, Types, Preparation Tips
How to Prepare for IELTS Pie Chart Task 1
-
Practice Regularly: Use official IELTS materials or past test questions to write responses within 20 minutes.
-
Get Feedback: Ask teachers or peers to review your work and suggest improvements.
-
Learn from Model Answers: Study Band 9 answers to understand the level of detail and language expected.
-
Improve Data Interpretation: Practice identifying key trends and summarising data quickly.
IELTS Writing Tips, Strategy, and Practice
Guidance of PW IELTS
Physics Wallah offers multiple online IELTS courses for all students. Follow the IELTS pages to better prepare for the exam.
| What is IELTS Exam? | Documents Required for IELTS Registration |
| IELTS exam eligibility requirements | IELTS Exam Fees |
| IELTS test results | IELTS Exam Pattern |
IELTS Pie Chart Writing Task 1 FAQs
How do I describe two pie charts in IELTS Task 1?
What vocabulary should I use for pie chart comparisons?
Can I get a Band 9 with a simple vocabulary?
Should I include exact figures in the overview?
What tense should I use for pie chart tasks?