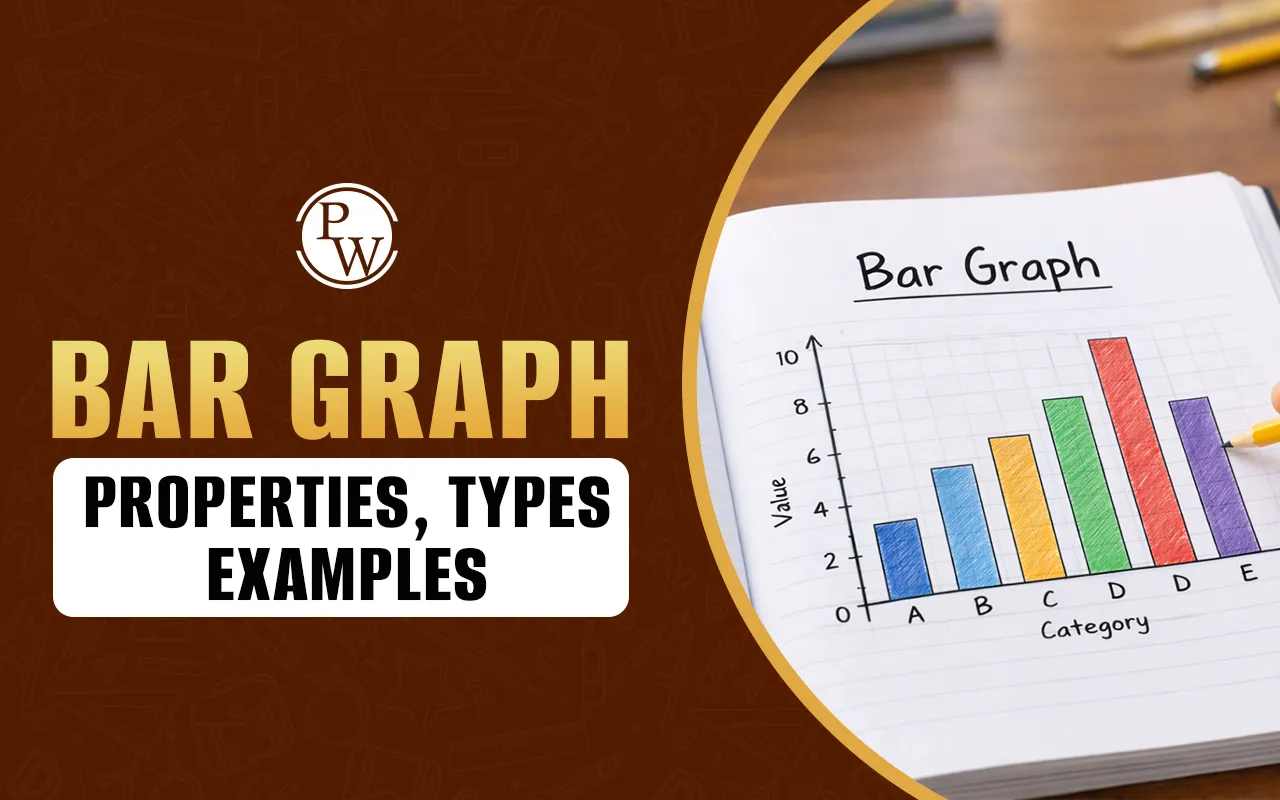
What is Bar Graph?
When dealing with large amounts of information, it can be difficult to spot trends or compare different categories. Students often find it challenging to interpret raw numbers without a visual aid. This is where a bar graph becomes incredibly useful. It transforms complex data into a simple visual format using rectangular bars of varying lengths.
By using a bar graph, you can quickly see which category is the highest, lowest, or how they relate to one another. Whether you are tracking monthly rainfall or favourite school subjects, this tool provides a clear and concise way to represent discrete data. In the following sections, we will explore the bar graph definition and its practical applications in daily life.
Bar Graph Definition
The core meaning of a bar graph must be understood before the chart construction process begins. The graph shows data through bars which extend to heights that match their corresponding value. The graphical representation serves as one of the most common methods for displaying statistical information because people can easily understand its content.
A common question students ask is: what is bar graph utility in the real world? Its primary purpose is to compare different groups or to track changes over time. The best applications for bar charts occur when distinct categories show substantial changes. The system helps users make fast choices by showing them how different data items compare to each other.
Bar Graph Properties
To draw or interpret a chart correctly, you must understand the specific bar graph properties. These rules ensure that the data is represented accurately and remains easy for the viewer to understand. Every standard chart follows a set of geometric and logical principles.
Key Characteristics of Bar Charts
-
Uniform Width: All bars in the graph must have the same width. Only the height or length changes based on the data.
-
Equal Spacing: The gaps between the bars should be consistent throughout the entire graph.
-
Base Line: All bars must start from a common base line, usually the zero mark on the axis.
-
Proportional Length: The height of a vertical bar or the length of a horizontal bar is directly proportional to its numerical value.
Different Types of Bar Graph
Not all data sets are the same, so there are different ways to arrange a bar graph. Depending on the space available or the type of comparison needed, you might choose one style over another. The two primary categories are based on the orientation of the bars.
Vertical Bar Charts
In a vertical chart, the rectangular bars are drawn standing up from the horizontal x-axis. The y-axis usually represents the frequency or the value, while the x-axis lists the categories. This is the most common format found in school textbooks.
Horizontal Bar Charts
A horizontal chart features bars that grow from left to right along the y-axis. Here, the categories are listed vertically, and the values are marked along the horizontal x-axis. This type is particularly useful when category names are very long and need more space to be written clearly.
Read More - Geometry: Overview, Branches, Formulas, Angles
Bar Graph Formula
While there isn't a single algebraic bar graph formula, the process of creating one relies on the concept of "Scale Selection." Choosing the right scale is the most important step in the construction process.
The Scaling Logic:
Scale Value = Maximum Data Value / Number of Desired Intervals
When you select a scale, you determine what each unit on the axis represents (e.g., 1 cm = 10 units). If your scale is too small, the graph will be too tall to fit on the paper; if it is too large, the bars will look like tiny lines, making them hard to compare. Proper scaling ensures the about bar graph presentation is professional and accurate.
Read More - Angles in Maths: Definition, Parts, Types, Measurement and Construction
Bar Graph Examples and Solved Problems
Looking at practical bar graph examples is the best way to learn how to plot one. Let’s consider a data set representing the number of children who like specific flavours of ice cream in a small group.
Data Table for Ice Cream Preferences
|
Ice Cream Flavour
|
Number of Children
|
|
Vanilla
|
10
|
|
Chocolate
|
25
|
|
Strawberry
|
15
|
|
Mint
|
5
|
|
Mango
|
20
|
How to Plot this Example
-
Identify the Variables: The flavours are the categorical data (x-axis), and the number of children is the numerical data (y-axis).
-
Select the Scale: Since the values range from 5 to 25, a scale of 1 unit = 5 children is perfect.
-
Label the Axes: Mark the Y-axis as "Number of Children" and the X-axis as "Flavours."
-
Draw the Bars: * Chocolate will have the tallest bar (5 units high).
-
Mint will have the shortest bar (1 unit high).
-
Vanilla (2 units), Strawberry (3 units), and Mango (4 units) follow.
Using these bar graph examples helps students understand that the taller the bar, the higher the frequency of that category.
Make Maths Easy and Enjoyable with CuriousJr
At CuriousJr, we help children remove their fear of maths and build a strong foundation in numbers with confidence. Our Mental Maths Online Classes for students from Classes 1 to 8 are designed to improve speed, accuracy, and logical thinking through simple techniques and interactive learning. With our dual-mentor system, students attend live classes and also get dedicated support for doubt solving after every session. Animated explanations, engaging activities, and fun challenges make learning maths interesting and effective. Parents receive regular progress updates and can also join review sessions to stay involved in their child’s learning journey.
Book a demo class today and discover how CuriousJr makes maths simple, engaging, and confidence-building for your child.