
ICSE Class 8 Maths Selina Solutions Chapter 22 Data Handling

ICSE Class 8 Maths Selina Solutions Chapter 22: In ICSE Class 8 Maths, Chapter 22 on Data Handling from Selina Solutions, you'll learn about organizing and interpreting data. This chapter helps you understand how to collect data, like numbers or measurements, and then organize it using tables, graphs, or charts.
You'll also learn methods to analyze data to find trends or patterns. This helps in making decisions based on facts and figures. Mastering this chapter will strengthen your skills in handling and presenting data effectively.ICSE Class 8 Maths Selina Solutions Chapter 22 Data Handling Overview
The solutions for ICSE Class 8 Maths Selina Solutions Chapter 22 on Data Handling are made by subject experts from Physics Wallah. They explain each step clearly and give examples to help you learn how to organize, understand, and use data well. Using these solutions can help you get better at handling data and do well in your studies.Data Handling
In mathematics, data handling refers to the process of working with data to organize, analyze, and interpret it effectively. It involves several key aspects:Data Collection: Gathering numerical or categorical information from various sources, such as surveys, experiments, or real-world observations.
Data Organization: Structuring data into tables, charts, graphs, or diagrams to make it easier to understand and analyze.
Data Analysis: Examining the data to identify patterns, trends, relationships, or outliers. This often involves calculations, statistical methods, and visual representations.
Interpretation: Drawing conclusions and making inferences based on the analyzed data. This step helps in making decisions, predictions, or recommendations.
ICSE Class 8 Maths Selina Solutions Chapter 22 Data Handling PDF
You can find the PDF link below for ICSE Class 8 Maths Selina Solutions Chapter 22 on Data Handling. It includes step-by-step solutions prepared by experts to help you understand concepts like organizing data into tables and graphs, analyzing trends, and making informed decisions based on data. Accessing this PDF can greatly enhance your understanding and performance in this chapter.ICSE Class 8 Maths Selina Solutions Chapter 22 Data Handling PDF
ICSE Class 8 Maths Selina Solutions Chapter 22 Data Handling
Below we have provided ICSE Class 8 Maths Selina Solutions Chapter 22 Data Handling for the ease of the students –ICSE Class 8 Maths Selina Solutions Chapter 22 Data Handling Exercise 22.1
Question 1.
Arrange the following data as an array (in ascending order):(i) 7, 5, 15, 12, 10, 11, 16
Solution:-
Ascending order = 5, 7, 10, 11, 12, 15, 16(ii) 6.3, 5.9, 9.8, 12.3, 5.6, 4.7
Solution:-
Ascending order = 4.7, 5.6, 5.9, 6.3, 9.8, 12.3Question 2.
Arrange the following data as an array (descending order):(i) 0, 2, 0, 3, 4, 1, 2, 3, 5
Solution:-
Descending order = 5, 4, 3, 3, 2, 2, 1, 0(ii) 9.1, 3.7, 5.6, 8.3, 11.5, 10.6
Solution:-
Descending order = 11.5, 10.6, 9.1, 8.3, 5.6, 3.7Question 3 .
Construct a frequency table for the following data: (i) 6, 7, 5, 6, 8, 9, 5, 5, 6, 7, 8, 9, 8, 10, 10, 9, 8, 10, 5, 7, 6, 8Solution:-
(i)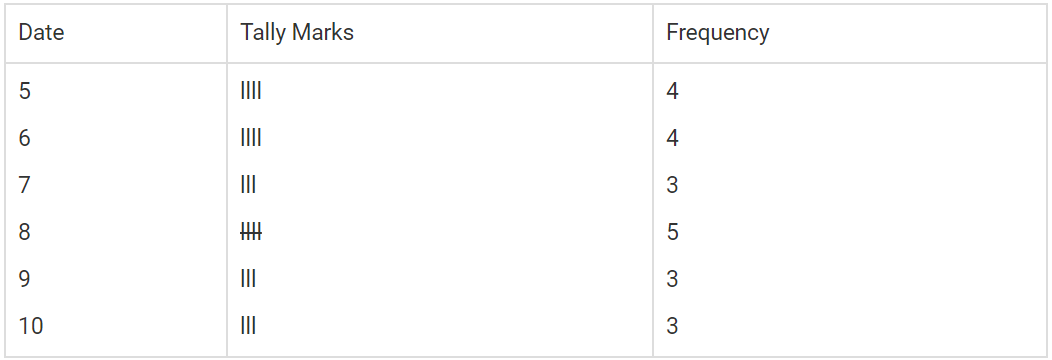 (ii) 3,2,1,5,4,3,2,5,5,4,2,2,2,1,4,1,5,4
Solution:-
(ii)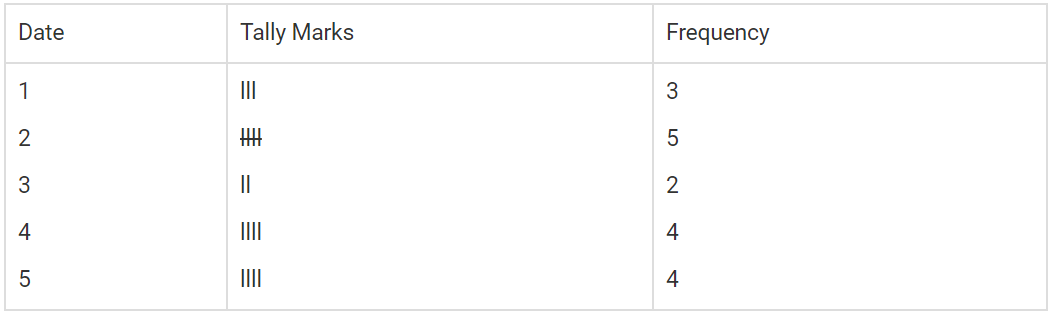
Question 4.
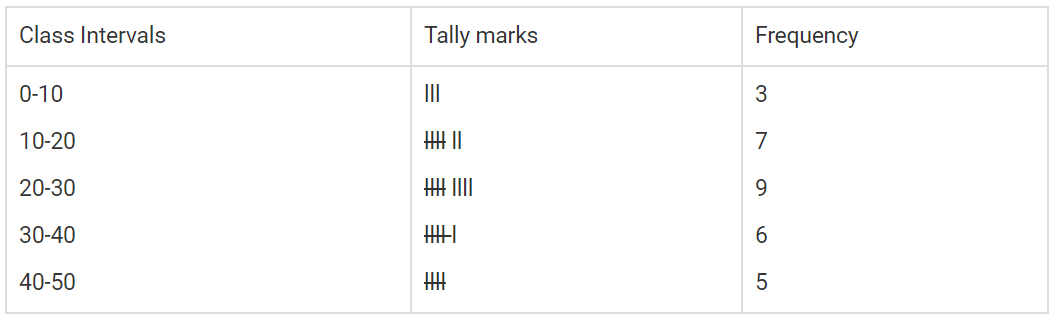
Following are the marks obtained by 30 students in an examination.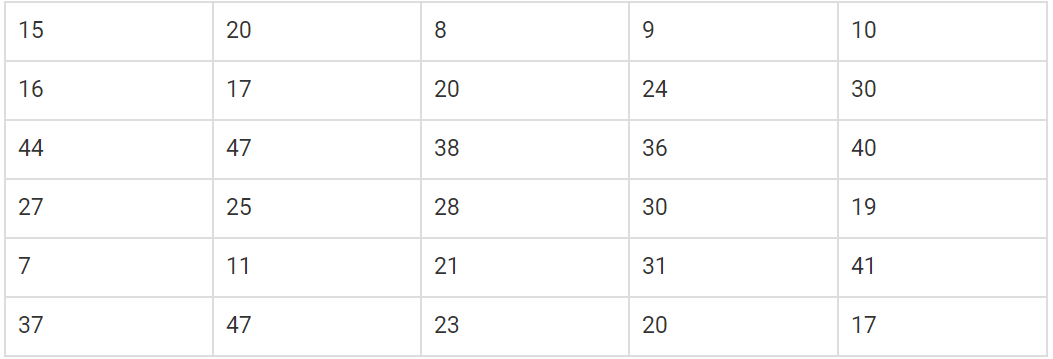 Taking class intervals 0-10, 10-20, …… 40-50; construct a frequency table.
Solution:-
Question 5.
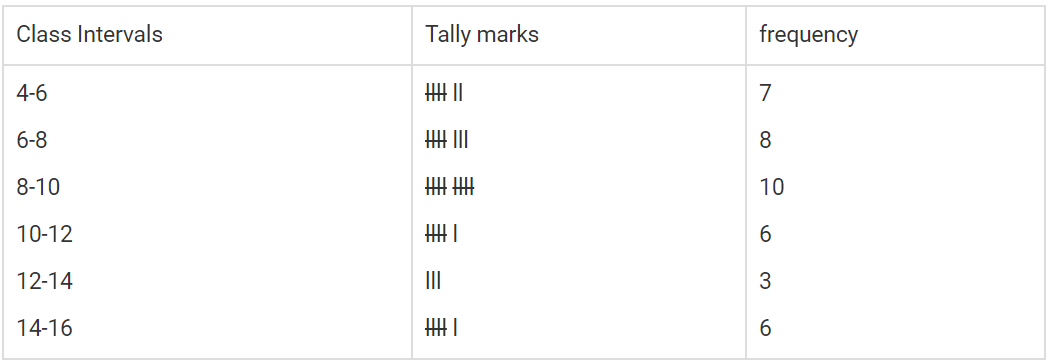
Construct frequency distribution table for the following data: taking class-intervals 4-6, 6-8, …….. 14-16. 11.5 6.3 7.8 9.2 10.5 4.5, 6 8.3 12.5 15.8 7.4 5.3 8.4 15.2 8.9 9.8 8.25 6.5 5.8 10.5 4.6 6.4 8.9 10.8 12.7 14.2 15.3 11.7 9.9 8.8 6.6 4.3 4.7 9.4 10.1 15.5 14.4 12.2 7.7 5.5Solution:-
Question 6.
Fill in the blanks: (i) Lower class limit of 15-18-is _________ (ii) Upper class limit of 24-30 is _________ (iii) Upper limit of 5-12.5 is _________ (iv) If the upper and the lower limits of a class interval are 16 and 10; the class-interval is _________ (v) If the lower and the upper limits of a class are 7.5 and 12.5; the class interval is _________Answer:
(i) Lower class limit of 15 – 18 is 15. (ii) Upper class limit of 24 – 30 is 30. (iii) Upper limit of 5 – 12.5 is 12.5 (iv) If the upper and the lower limits of a class interval are 16 and 10; the class-interval is 10 – 16 (v) If the lower and the upper limits of a class are 7.5 and 12.5; the class interval is 7.5 – 12.5ICSE Class 8 Maths Selina Solutions Chapter 22 Data Handling Exercise 22.2
Question 1.
Hundred students from a certain locality use different modes of travelling to school as given below. Draw a bar graph.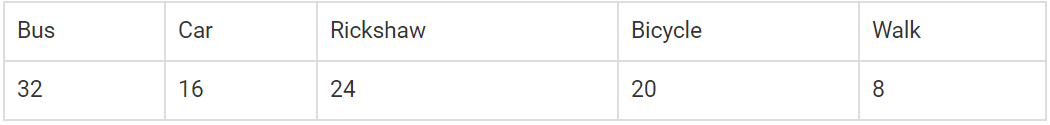
Solution:-
Question 2 .
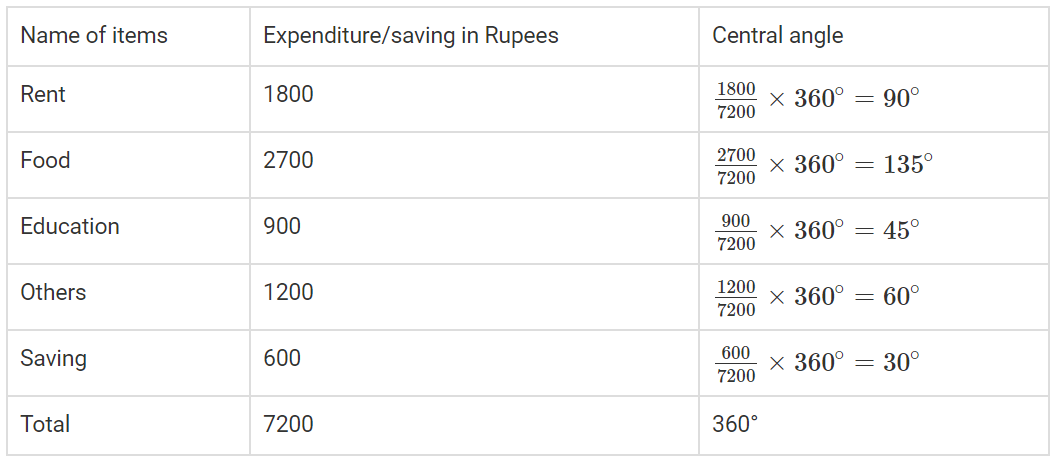
Mr. Mirza’s monthly income is Rs. 7,200. He spends Rs.1,800 on rent, Rs.2,700 on food, Rs.900 on education of his children; Rs. 1,200 on other things and saves the rest. Draw a pie-chart to represent it.Solution:-
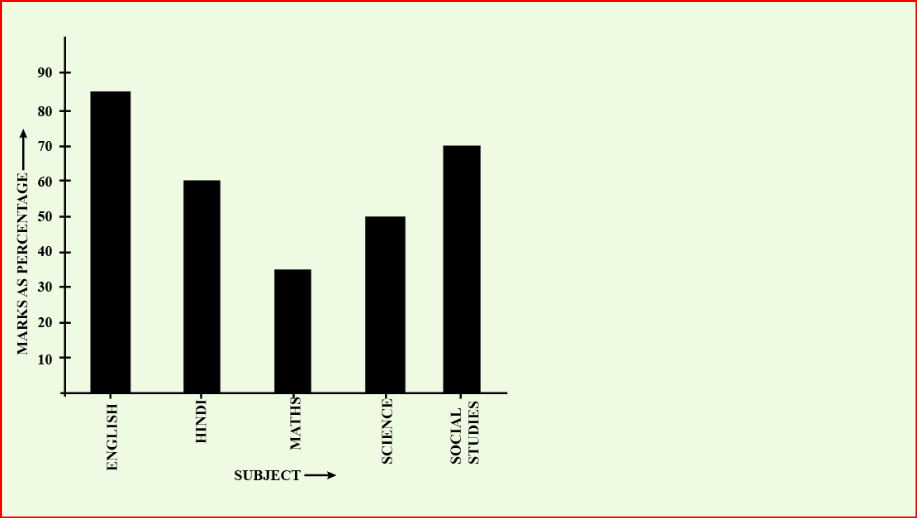
Question 3. The percentage of marks obtained, in different subjects by Ashok Sharma (in an examination) are given below.
Draw a bar graph to represent it.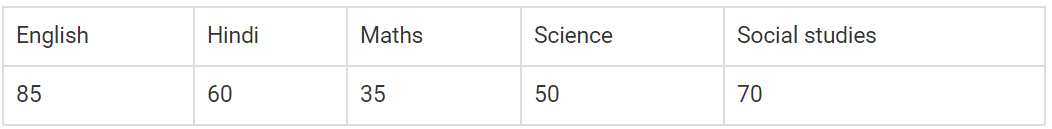
Solution:-
Question 4.
The following table shows the market position of different brand of teal leaves.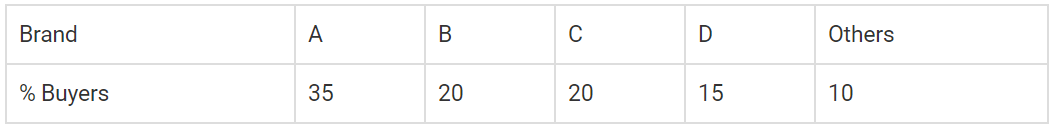 Draw it-pie-chart to represent the above information.
Solution:-

Question 5.
Students of a small school use different modes of travel to school as shown below: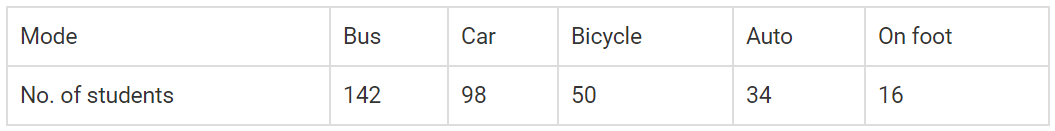 Draw a suitable bar graph.
Solution:-

Question 6.
For the following table, draw a bar-graph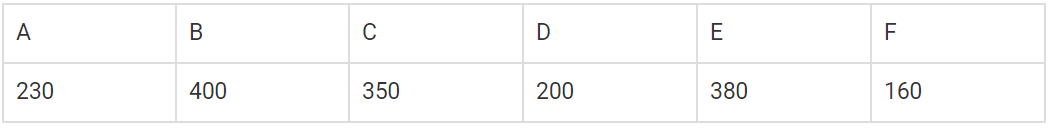
Solution:-
From the given data, D has the maximum value of 350.
Question 7.
Manoj appeared for ICSE examination 2018and secured percentage of marks as shown in the following table: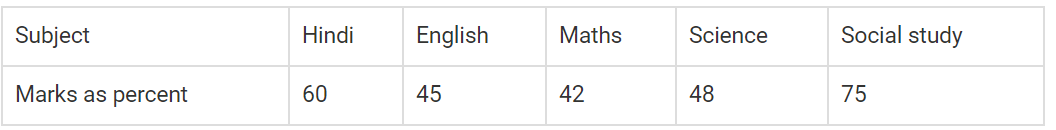 Represent the above data by drawing a suitable bar graph.
Solution:-
Question 8.
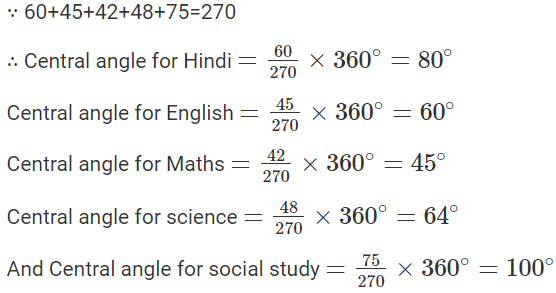
For the data given above in question number 7, draw a suitable pie-graph.Solution:-
Benefits of ICSE Class 8 Maths Selina Solutions Chapter 22
Clear Understanding: The solutions provide clear explanations and examples that help students understand how to organize, analyze, and interpret data effectively.
Step-by-Step Guidance: Students receive step-by-step guidance on solving problems related to data handling, enhancing their problem-solving skills.
Practical Application: By practicing with these solutions students can apply mathematical concepts to real-world scenarios involving data, improving their ability to make informed decisions.
Concept Reinforcement: The solutions reinforce key concepts such as data representation (using tables, graphs, etc.), data analysis (finding averages, trends), and basic probability, ensuring a strong foundation in these areas.
Preparation for Exams: Using these solutions helps students prepare thoroughly for exams by providing comprehensive coverage of the chapter's topics and helping them practice questions of varying difficulty levels.
ICSE Class 8 Maths Selina Solutions Chapter 22 FAQs
What is data handling?
Why is data handling important?
What are the different types of data?
What is data analysis?
What is the role of probability in data handling?