IELTS Line Graph Writing Task 1 Sample Answers with Questions
Share
IELTS Line Graph Writing Task 1: The line graph task is one of the three tasks in the IELTS Writing test . In the IELTS Line Graph Writing Task 1 , aspirants are presented with a line graph depicting various trends over time. In the IELTS Academic Writing Task 1, candidates are often given a line graph to describe. This task checks how well you understand visual data and how clearly you can report trends and comparisons in English. To score well, you must describe key features, support your ideas with data, and organise your answer logically.
Here, we have provided a detailed insight into the IELTS Line Graph Writing Task 1 including a basic understanding of the graph, a standard structure to write answers, effective strategies, and common mistakes to avoid while attempting the test. Students who are looking for IELTS Line Graph Writing Task 1 sample questions can follow the page to learn answer writing structure with sample model answers. Test-takers can use these sample practice questions and answers as a standard format for framing their own answers for the IELTS exam 2025.What Is a Line Graph in IELTS Writing Task 1?
A line graph presents information that changes over time. It shows trends, fluctuations, or patterns using points connected by lines. The data might be about populations, prices, employment rates, or other measurable factors.
Key Features of a Line Graph
-
Time is usually shown on the x-axis (horizontal).
-
The y-axis shows quantities like percentages or numbers.
-
There may be multiple lines to compare different categories or groups.
How to Write a Line Graph Answer
To complete a line graph task successfully, follow these four steps:
1. Introduction
Paraphrase the question. Do not copy directly.
2. Overview
Summarise the main trends without including detailed figures.
3. Body Paragraph 1
Describe the first set of trends using data from the graph.
4. Body Paragraph 2
Continue describing and comparing other trends.
Use linking words like while, whereas, in contrast, and similarly to connect ideas. Always refer to specific data in your explanation.
IELTS Writing Scoring, Marking Scheme and Score
IELTS Line Graph Writing Task 1 Practice Question
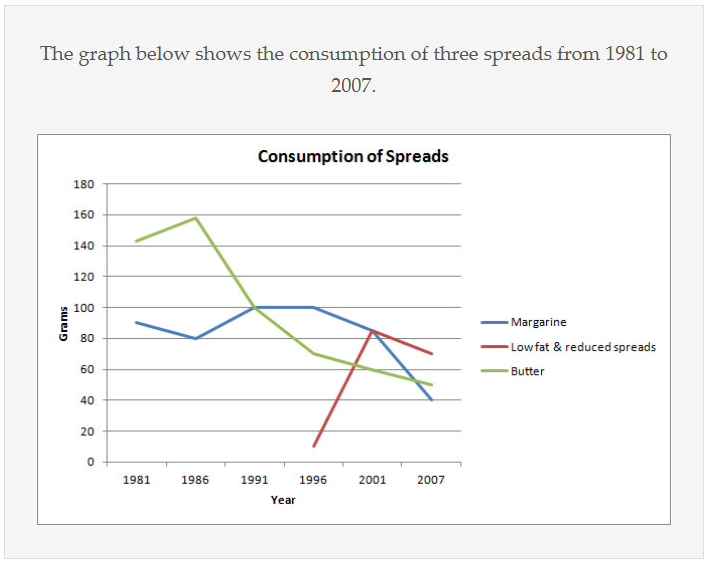
Question 1: The line graph illustrates the consumption of three types of spreads - margarine, low-fat and reduced spreads, and butter - in a country between 1981 and 2007. Summarize the key features of the information shown, selecting and reporting the main features, and making comparisons where relevant.
IELTS Line Graph Writing Task 1 Sample Answer
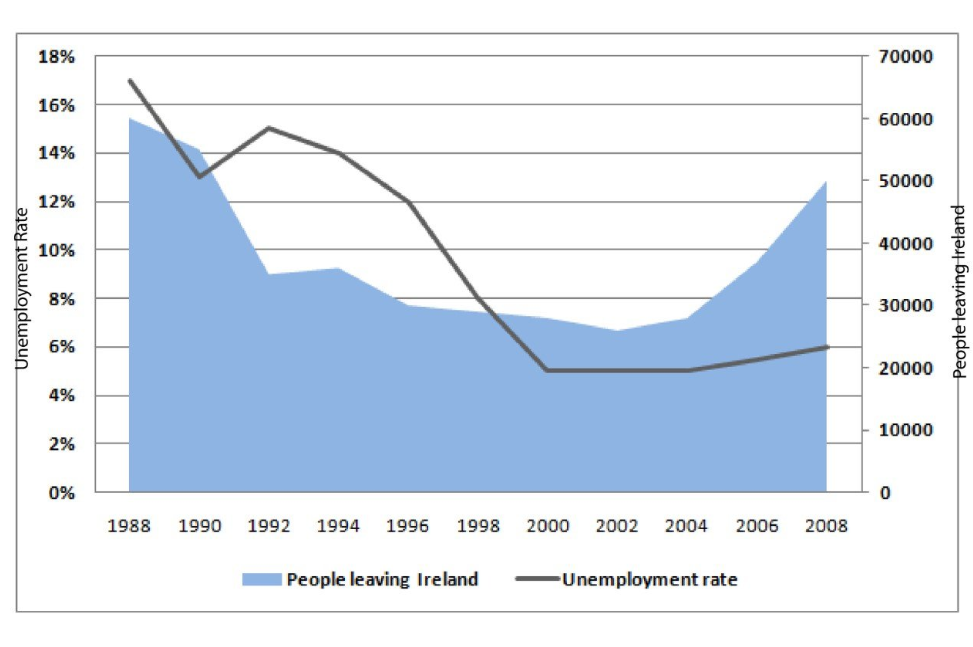
The line graph illustrates an overview of the consumption of three spread types over a 26-year period from 1981 to 2007 in a country. From the given line graph, we can see that the consumption of butter started at a relatively high level in 1981 and continued till 1986. However, shows a rapid decline from 1986 until 2007. Whereas, the consumption of margarine shows an early drop decline from 1981 to 1986. Whereas, its consumption showed a period of stability until 1991, however, reached its lowest point in 2007. On the other hand, the consumption of low-fat and reduced experienced a sharp increase from 2001 until 2007. However, its consumption remained relatively low until the mid-1990s. From the presented data sets, a major shift is observed in consumer preferences over a 26-year period. A sharp transfer of preference is observed from butter and margarine consumption to consumption of low-fat and reduced spreads over the years.Question 2: The line graph illustrates the relationship between unemployment rates in Ireland and the number of people emigrating from the country between 1988 and 2008. Summarize the key features of the information shown, selecting and reporting the main features, and making comparisons where relevant.
 IELTS Line Graph Writing Task 1 Sample Answer
The line graph presents a compelling picture of the correlation between unemployment rates and emigration from Ireland between 1988 and 2008. Check:- Types of IELTS Writing Task 1 questions
Tips for Answering IELTS Line Graph Writing Task 1
Here are some common tricks and tips for answering line graph questions in the IELTS Writing Task 1 test:- Spend a few minutes analysing the graph before writing
- Write a clear overview without figures
- Use a range of vocabulary and grammar
- Focus on main trends rather than small details
- Stick to formal, academic tone
Vocabulary for Line Graph Descriptions
Using accurate IELTS vocabulary helps convey your message clearly. Below are useful words for line graph writing:
Verbs to Describe Changes
-
Increase, rise, grow, climb
-
Decrease, fall, drop, decline
-
Fluctuate, remain steady, peak, reach a low
Adverbs and Adjectives
-
Slightly, gradually, steadily, rapidly, significantly
-
Sharp, steady, gradual, moderate, dramatic
Phrases to Show Trends
-
There was a noticeable increase in…
-
The number remained stable…
-
A sharp decline occurred between…
-
The figures peaked in…
Common Mistakes to Avoid
Below is the list of some common mistakes aspirants should avoid to score higher in the IELTS Line Graph Writing Task 1 section:- Copying the question instead of paraphrasing
- Skipping the overview, which is essential for a Band 7+
- Listing numbers without comparisons or trends
- Using informal language (avoid contractions like “don’t” or slang)
- Failing to describe all lines, especially when multiple trends are shown
| IELTS Writing Task 1 Related Links | |
|---|---|
| IELTS General Writing Task 1 | IELTS Writing Task 1 Connectors |
| IELTS Writing Task 1 vs. Writing Task 2 | IELTS Writing Word Limit Guidelines |
IELTS Line Graph Writing Task 1 FAQs
How many paragraphs should I write for a line graph task?
Should I include every number in the graph?
What tenses should I use in my answer?
Can I give my opinion in Task 1?
How long should my answer be?