Funnel Chart DI Questions for IBPS RRB PO and Clerk


Funnel Chart DI
Funnel Data Interpretation (DI) is a unique type of data analysis encountered in the IBPS RRB PO and Mains Exam. Candidates unfamiliar with funnel DI may struggle with these questions. Therefore, it is crucial to learn the basics from our funnel DI PDF. Once you understand the fundamentals, you can approach funnel DI questions in bank exams with ease.
Consistent practice with our funnel DI questions PDF will help you master the basics. In banking mains exams, funnel DI questions are often of a high standard and can be time-consuming to solve. To manage the difficulty level, practice a variety of funnel DI examples. Continuous practice with our Funnel Data Interpretation will help you improve your speed and maintain accuracy.
Key Concepts of Funnel Chart DI
-
Stages: Different steps in a process, such as application stages in a loan process or sales stages in customer acquisition.
-
Data Values: Numerical values or percentages representing the number of entities at each stage.
-
Shape: Typically, a funnel chart narrows down from top to bottom, indicating a decrease in values at each subsequent stage.
How to Solve Funnel Chart DI?
To solve funnel chart data interpretation (DI) questtions effectively, follow these steps:
1. Understand the Funnel Date Interpretation
-
Identify Stages: Note the different stages represented in the funnel chart.
-
Data Values: Observe the numerical values or percentages at each stage.
-
Flow Direction: Recognize that the data typically flows from the widest part (top) to the narrowest part (bottom).
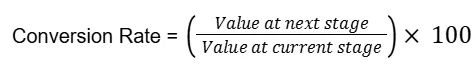
2. Calculate Conversion Rates
Conversion Rate Formula:
3. Identify Drop-Offs and Bottlenecks
-
Drop-Off Rate:
Drop-Off Rate = 100%−Conversion Rate
-
Look for the stages with the largest drop-offs to identify bottlenecks.
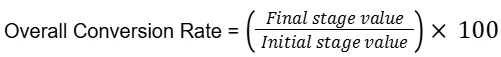
4. Calculate Overall Conversion Rate
-
Overall Conversion Rate:
5. Analyze Trends and Insights
-
Trends: Identify where the most significant changes occur.
-
Efficiency: Evaluate which stages are most and least efficient.
Weighatge of Funnel Chart DI in Banking Exams
The weightage of funnel chart data interpretation (DI) in banking exams can vary depending on the specific exam and the pattern adopted by the examining body. In many banking exams, the data interpretation section may account for a significant portion of the total marks, often around 20-25%. Within this section, funnel chart questions might contribute a smaller proportion, such as 5-10%, depending on the exam.
Funnel Date Interpretation Solved Questions
The below data shows the number of applications received for the recruitment of AAO and ADO in the banks. Among the Students, some were called for exams, some students were absent and some attended the exams. There are two types of recruitments there, AAO and ADO. The AAO works in two types of banks one is Top banks and other is Below average banks.
Number of people applied for AAO work = A
Number of people applied for Clerk = B
(Note: Values given in percentage are out of the number of application received and values obtained in one question can be used in other)

1. If 83.33% of the students who applied gave exams for AAO and ADO. If 16.66% of the applied students got failed in the exam and the ratio of the failed AAO and ADO students are 1:1, then how many failed non-selected Students are there who applied for AAO?
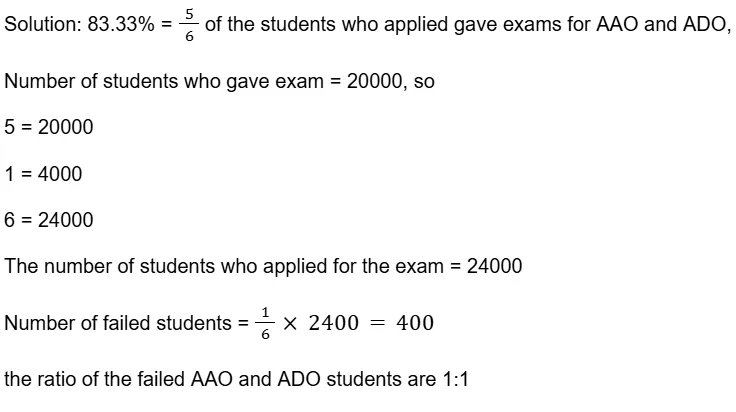
Number of failed non-selected Students are there who applied for AAO = 2000
Number of failed non-selected Students are there who applied for ADO = 2000
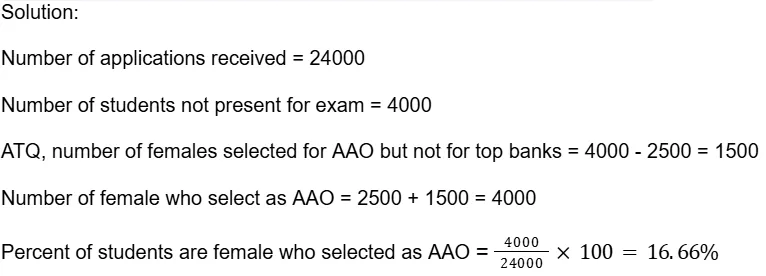
2. If the number of Students not present for exam are 2500 more than the number of females selected for AAO but not for Top banks, then find the value of D.
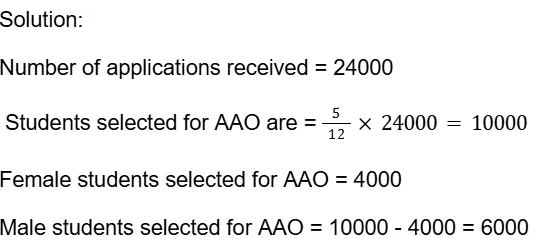
3. If Students selected for AAO are 5/12th number of applications received, then how many males are selected for AAO?
4. If the number of applications received for AAO are 8000 more than the number of applications received for ADO, then students selected for ADO are approximately what percent of students applied for ADO?
Solution:
The number of applications received for AAO are 8000 more than the number of applications received for ADO
Number of applications received for ADO = 8000
Number of applications received for AAO = 24000 - 8000 = 16000
Number of failed non-selected Students are there who applied for AAO = 2000
Total students who selected for AAO = 10000
Total students who gave AAO exam = 10000 + 2000 = 12000
Number of applications received for AAO = 24000 - 8000 = 16000
Difference = 16000 - 12000 = 4000
Number of applications received for ADO = 8000
Number of failed non-selected Students are there who applied for ADO = 2000
Difference = 8000 - 2000 = 6000

5. If 16.66% Students did not come for the exam, then what is the value of 2C - 180D - 2B?
Solution:
The value of C = 10000
The value of D = 16.66
The value of B = 8000
The value of 2C - 180D - 2B
210000 - 18016.66 - 28000=4000-30
20000 - 3000 - 16000
= 1000
Funnel Chart DI FAQs
Q1. What is Funnel Data Interpretation?
Q2. How is a Funnel Chart Structured?
Q3. What types of questions are asked in Funnel Data Interpretation?
Q4. What skills are essential for interpreting Funnel Data?
Q5. How can I improve my skills in Funnel Data Interpretation?